Monitoring and Observability with Genkit Go
Genkit Go comes fully instrumented with metrics and traces out of the box, providing powerful observability capabilities for your AI applications. This chapter explores the various monitoring and observability options available, from development-time debugging to production monitoring across different platforms.
What is OpenTelemetry?
OpenTelemetry (often abbreviated as OTel) is an open-source observability framework that provides a standardized way to collect, process, and export telemetry data (metrics, traces, and logs) from applications. It’s vendor-neutral, meaning you can use it with any observability backend, and it has become the industry standard for application observability.
OpenTelemetry consists of:
- APIs and SDKs for instrumenting applications
- Collectors for receiving, processing, and exporting telemetry data
- Exporters for sending data to various observability backends
- Instrumentation libraries for popular frameworks and libraries
Genkit Go uses OpenTelemetry internally, which means you get automatic instrumentation of your AI flows, model calls, and other operations without additional configuration.
OpenTelemetry Architecture
The following diagram illustrates how OpenTelemetry works within a Genkit Go application:
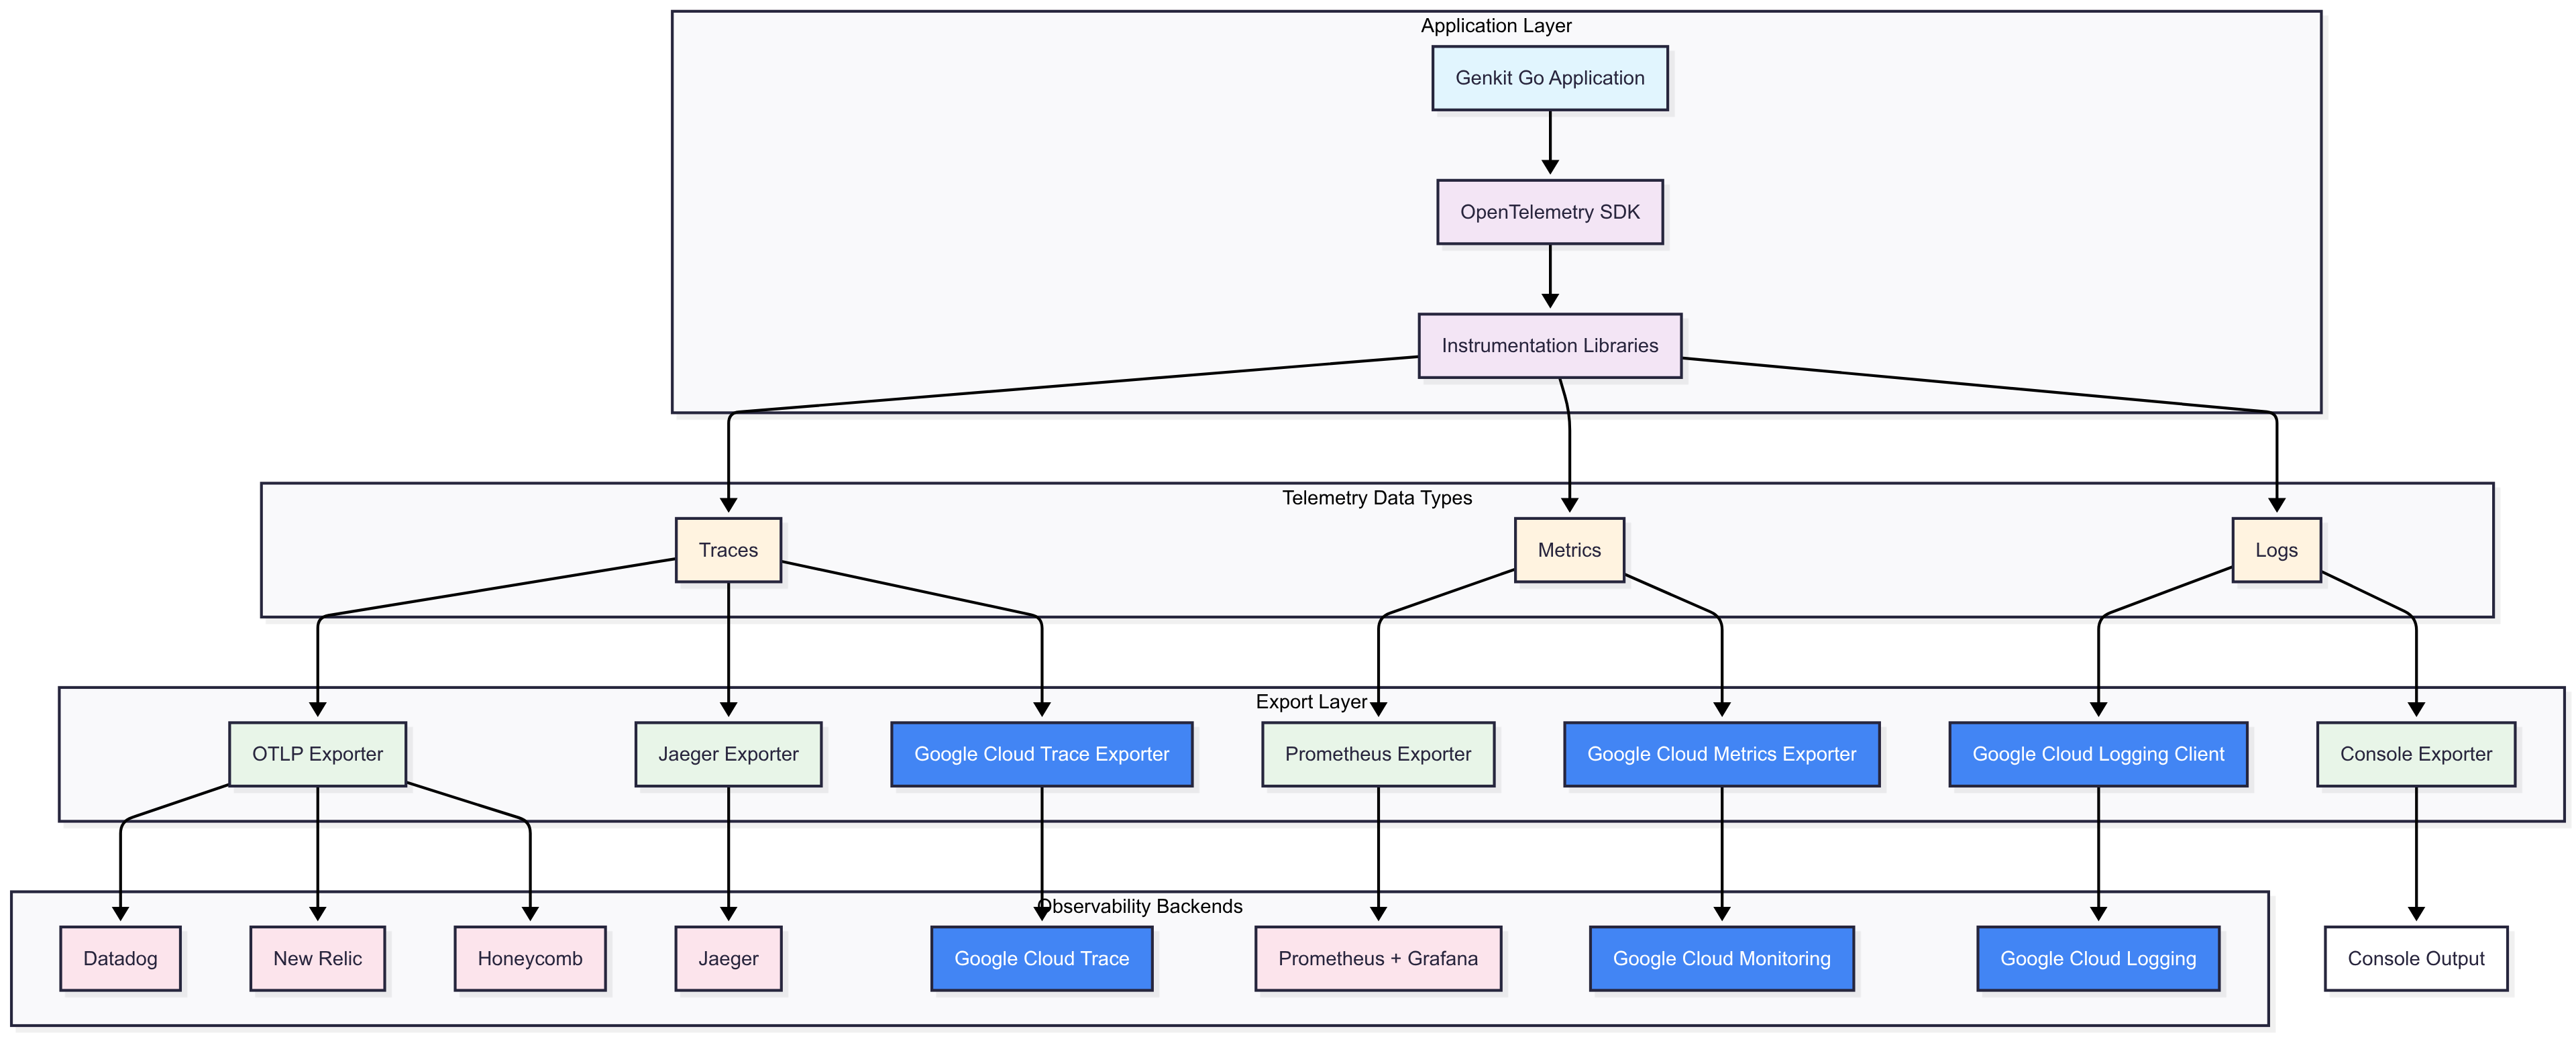
This architecture shows the flow from your Genkit Go application through the OpenTelemetry SDK to various observability backends, demonstrating the flexibility and vendor-neutral approach of OpenTelemetry.
Prerequisites
Before diving into the examples, ensure you have the following prerequisites set up:
- Go 1.26+: Ensure you have Go installed and set up on your machine.
- Genkit Go: Understand the basics of Genkit Go and how to create AI applications.
- OpenTelemetry: Familiarize yourself with OpenTelemetry concepts and components.
- AWS Credentials: For examples using AWS Bedrock, ensure you have your AWS credentials configured.
- Google Cloud Credentials: For examples using Google Cloud monitoring, ensure you have your Google Cloud project set up and authenticated.
Observability While Developing Using the Genkit UI
During development, Genkit provides a built-in developer UI that offers real-time visibility into your application’s behavior. This UI is perfect for debugging flows, understanding model interactions, and optimizing performance.
Accessing the Genkit UI
The Genkit UI is automatically available when you run your application in development mode by running genkit start -- go run .. Simply start your application and navigate to the Genkit UI URL http://localhost:4000.
This is what you can do with the Genkit UI in terms of observability:
- Flow Execution Timeline: Visual representation of flow execution with timing information
- Trace Visualization: Detailed view of spans, including model calls, tool usage, and custom operations
- Request/Response Inspection: Examine inputs and outputs at each step
- Performance Metrics: Latency, token usage, and other performance indicators
Example: Using the Developer UI
// Example from src/examples/chapter-13/otel/main.go
func main() {
    ctx := context.Background()
    bedrockPlugin := &bedrock.Bedrock{
        Region: "us-east-1",
    }
    // Initialize Genkit with OpenTelemetry support
    g := genkit.Init(ctx,
        genkit.WithPlugins(
            bedrockPlugin,
        ),
    )
    bedrock.DefineCommonModels(bedrockPlugin, g)

    // Your flows and handlers here...
}
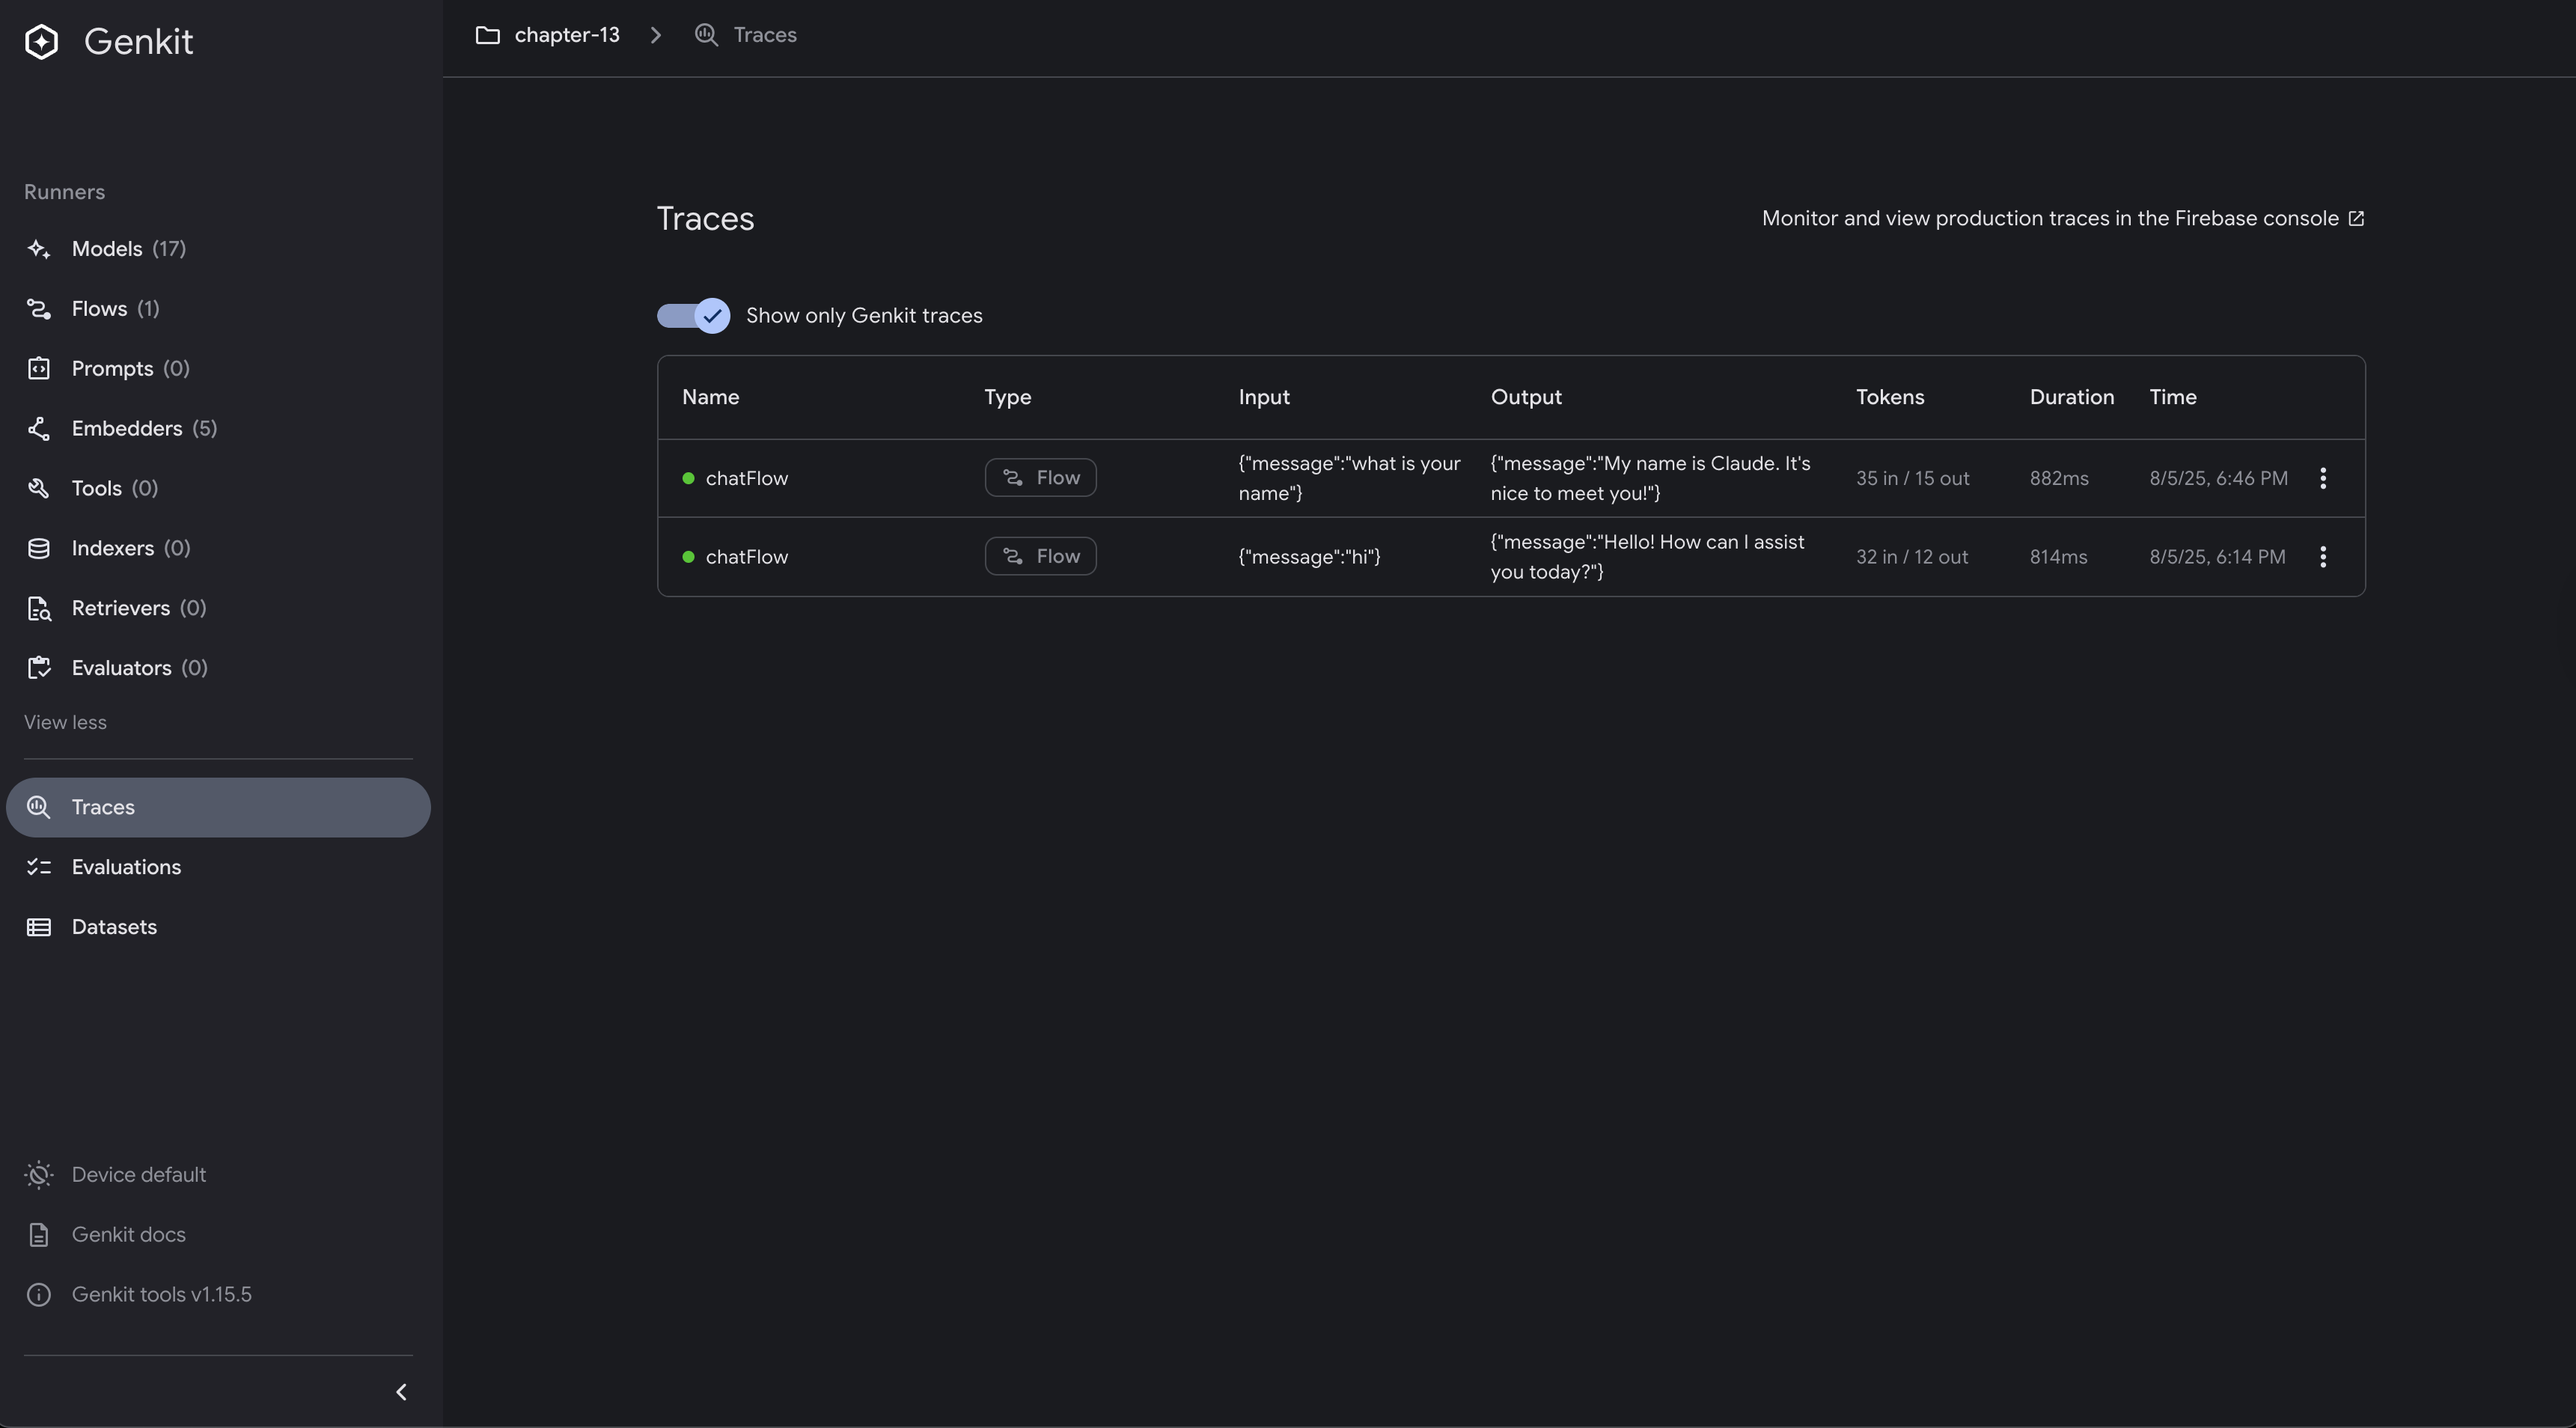
When you run this example, the Genkit UI will show traces of all operations, making it easy to debug and optimize your flows during development:
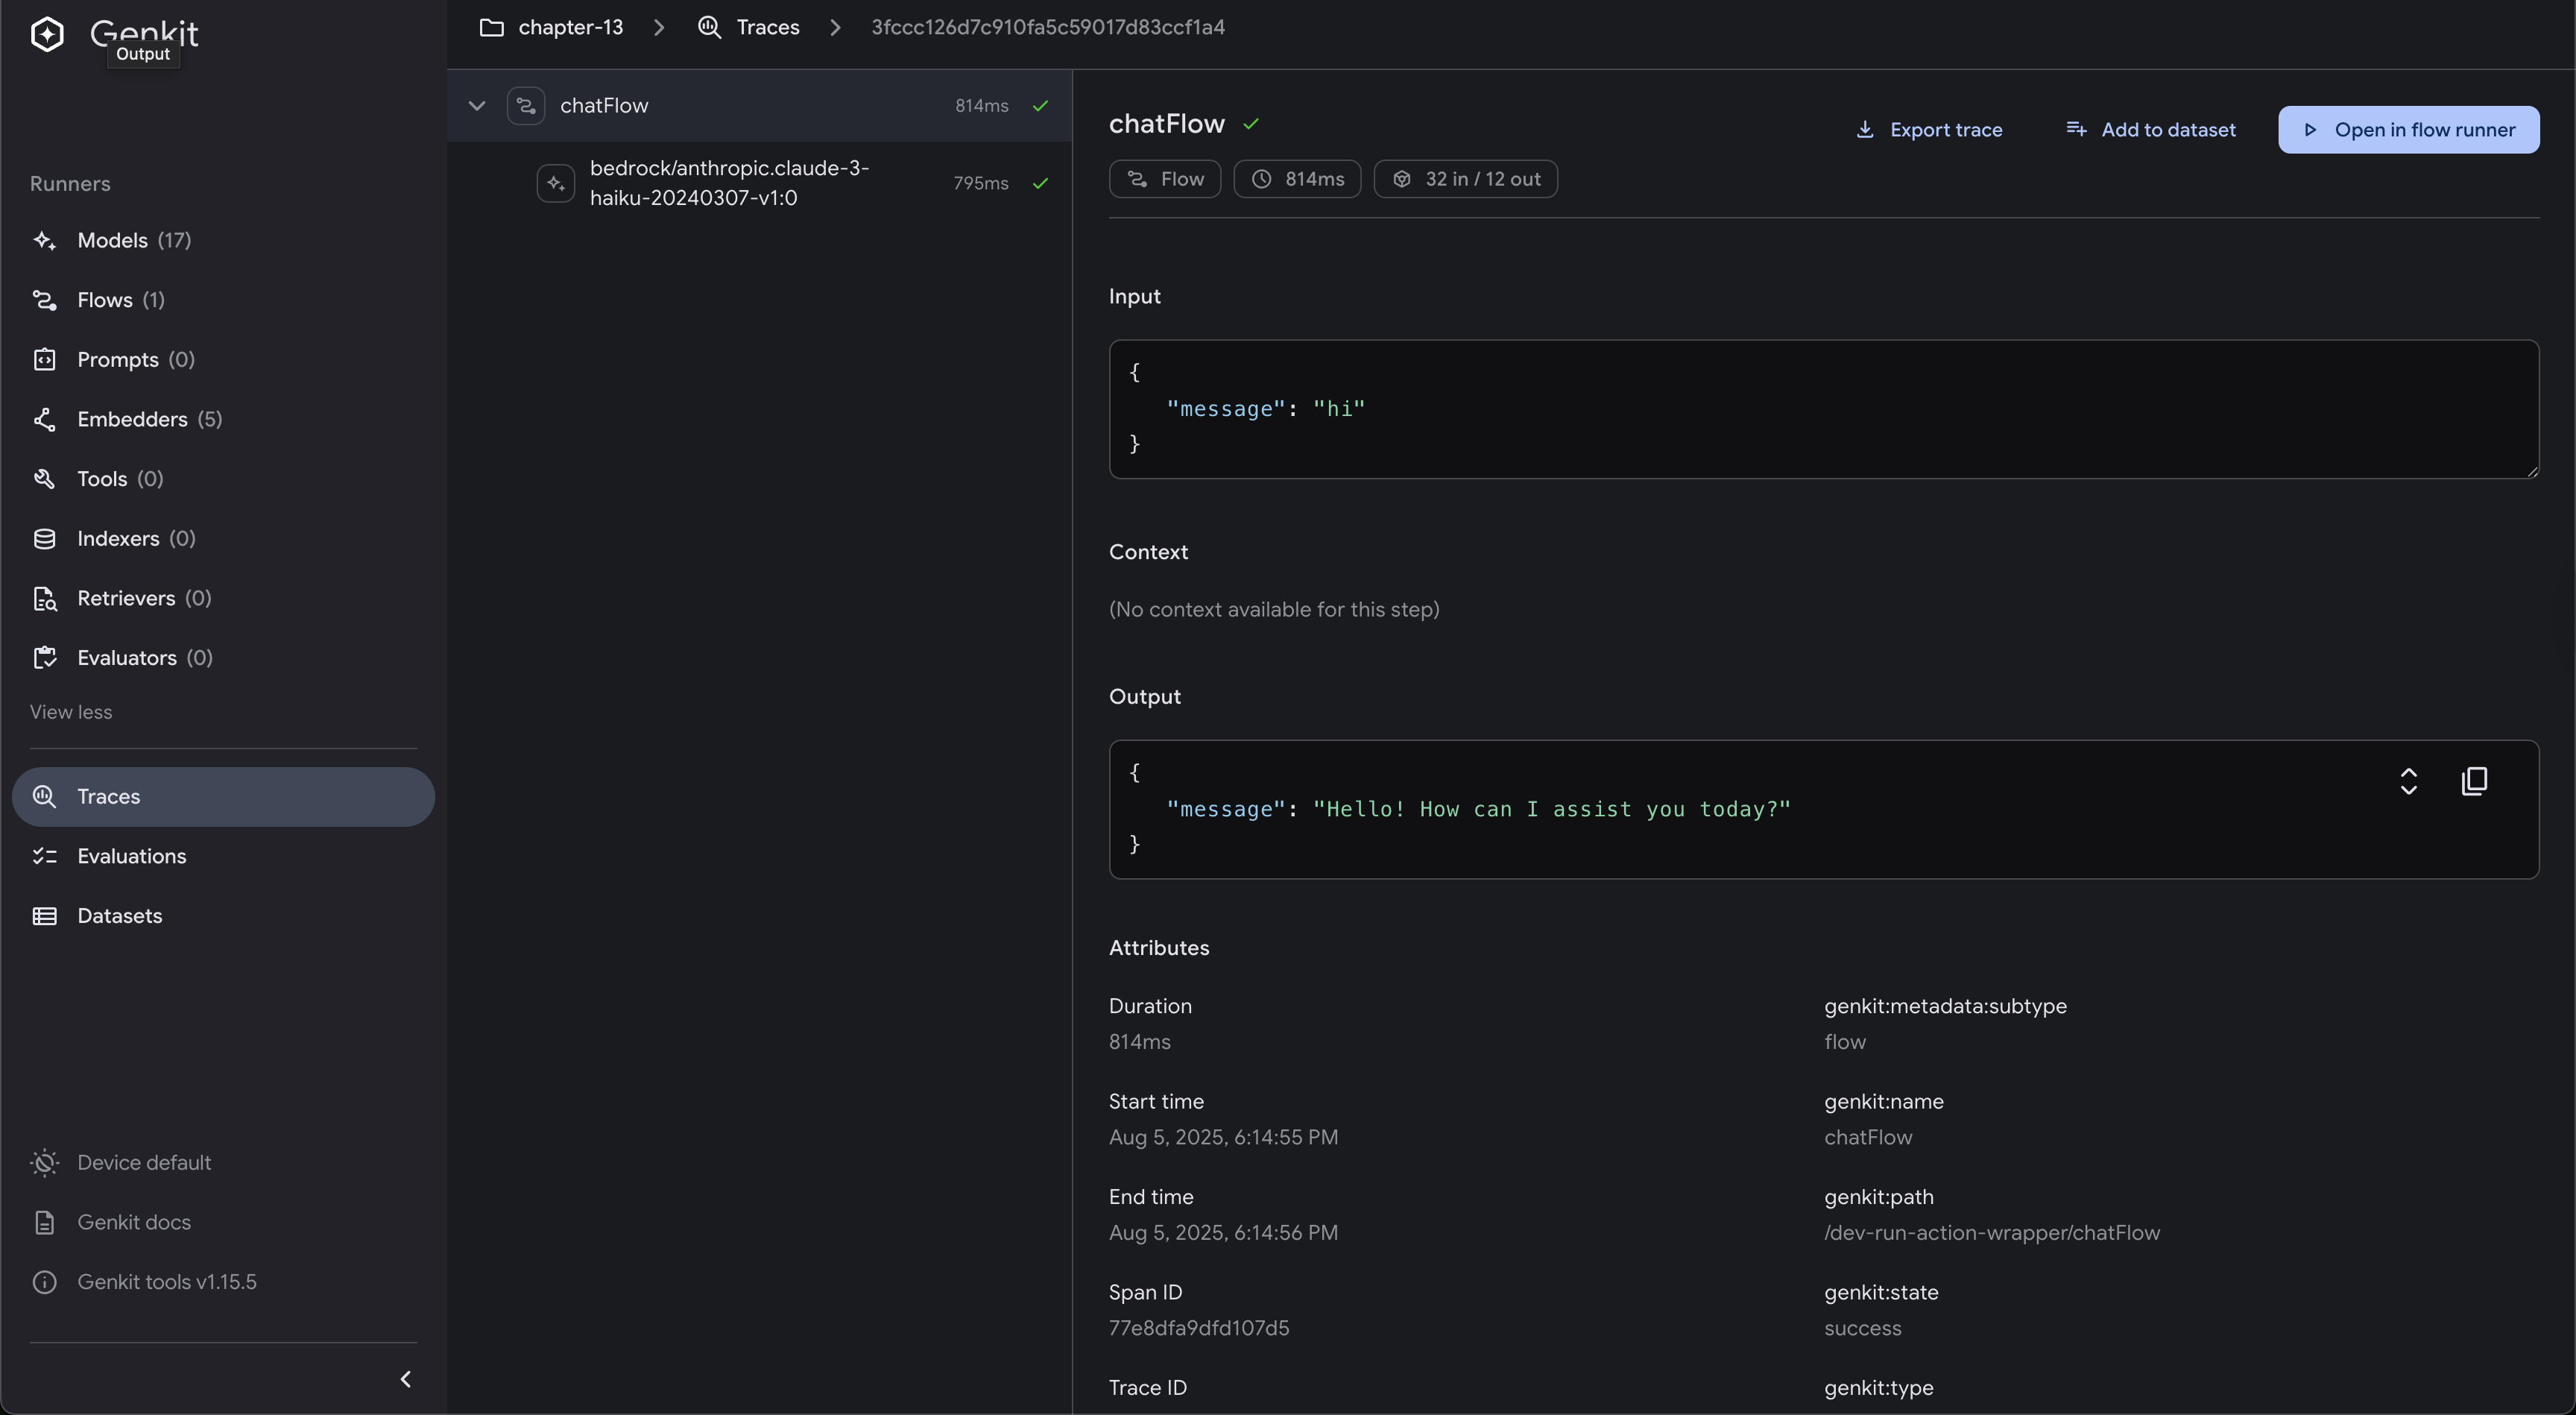
You can also inspect any individual flow execution, view the trace spans, and see how long each operation took, including model calls and tool executions:
Firebase AI Monitoring
Firebase offers an AI monitoring solution with built-in dashboards and performance tracking, providing excellent integration with Google’s ecosystem. Genkit Go now supports Firebase monitoring through the Firebase plugin.
Setting Up Firebase Monitoring
To use Firebase monitoring with Genkit Go, you need to configure the Firebase plugin:
// Example from src/examples/chapter-13/firebase/main.go
import (
    "github.com/firebase/genkit/go/plugins/firebase"
)

func main() {
    ctx := context.Background()
    bedrockPlugin := &bedrock.Bedrock{
        Region: "us-east-1",
    }

    // Initialize Genkit
    g := genkit.Init(ctx,
        genkit.WithPlugins(
            bedrockPlugin,
        ),
        genkit.WithDefaultModel("bedrock/anthropic.claude-3-haiku-20240307-v1:0"),
    )

    // Enable Firebase telemetry
    firebase.EnableFirebaseTelemetry(&firebase.FirebaseTelemetryOptions{
        ProjectID:      "my-project-id", // Replace with your Firebase project ID
        ForceDevExport: true,           // Export even in dev environment
    })

    bedrock.DefineCommonModels(bedrockPlugin, g)

    // Your flows and handlers here...
}
Firebase Telemetry Configuration
The FirebaseTelemetryOptions allows you to configure various aspects of the Firebase monitoring integration:
type FirebaseTelemetryOptions struct {
    // ProjectID is the Firebase/Google Cloud project ID.
    // If empty, will be read from FIREBASE_PROJECT_ID or GOOGLE_CLOUD_PROJECT environment variables.
    ProjectID string

    // ForceDevExport forces telemetry export even in development environment.
    // Defaults to false (only exports in production unless forced).
    ForceDevExport bool

    // DisableLoggingInputAndOutput disables input/output logging.
    // Defaults to false (input/output logging enabled).
    DisableLoggingInputAndOutput bool
}
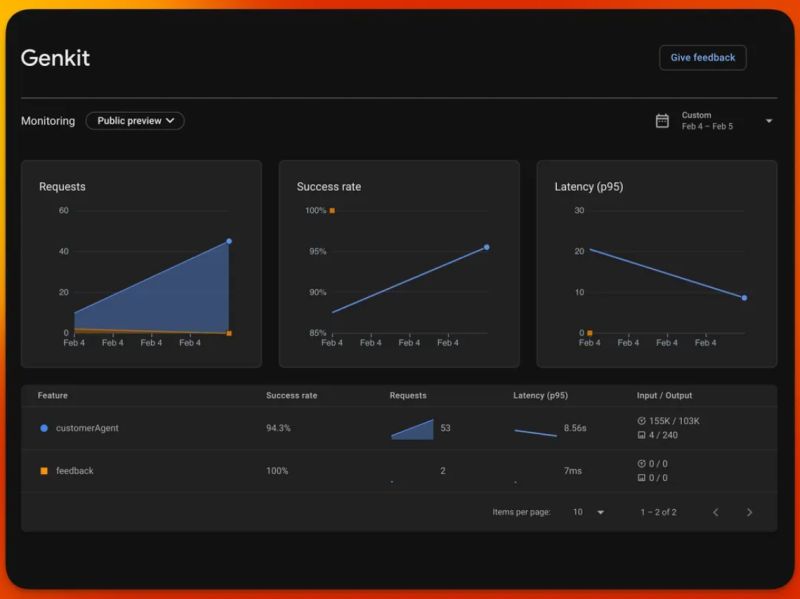
Firebase Monitoring Features
Firebase monitoring provides several key capabilities:
- AI Flow Traces: Track the execution of your AI flows with detailed timing information
- Model Performance Metrics: Monitor model response times, token usage, and success rates
- Error Tracking: Automatic detection and reporting of errors in your AI workflows
- Cost Analytics: Track token consumption and associated costs across different models
Required APIs for Firebase Integration
To use Firebase monitoring with Genkit Go, you’ll need to enable these APIs in your Google Cloud Console (Firebase projects are automatically linked to Google Cloud):
- Cloud Logging API: For centralized log collection and analysis
- Cloud Trace API: For distributed tracing across services
- Cloud Monitoring API: For metrics collection and alerting
Prerequisites for Firebase Monitoring
Before using Firebase monitoring, ensure you have:
- Firebase Project: A Firebase project set up with your Google account
- Google Cloud Authentication: Proper authentication configured using
gcloud auth application-default login - Project Permissions: Appropriate permissions to write monitoring data to your Firebase project
- APIs Enabled: The required APIs listed above enabled in your Google Cloud Console
Google Cloud Monitoring
Google Cloud provides a robust monitoring and observability platform that integrates seamlessly with Genkit Go applications. This option is ideal for applications deployed on Google Cloud or those that need enterprise-grade monitoring capabilities.
Setting Up Google Cloud Monitoring
To use Google Cloud monitoring with Genkit Go, you need to configure the Google Cloud telemetry:
// Example from src/examples/chapter-13/cloud/main.go
import (
    "github.com/firebase/genkit/go/plugins/googlecloud"
)

func main() {
    ctx := context.Background()
    bedrockPlugin := &bedrock.Bedrock{
        Region: "us-east-1",
    }

    // Initialize Genkit
    g := genkit.Init(ctx,
        genkit.WithPlugins(
            bedrockPlugin,
        ),
        genkit.WithDefaultModel("bedrock/anthropic.claude-3-haiku-20240307-v1:0"),
    )

    // Enable Google Cloud telemetry
    googlecloud.EnableGoogleCloudTelemetry(&googlecloud.GoogleCloudTelemetryOptions{
        ProjectID:      "my-project-id", // Replace with your Google Cloud project ID
        ForceDevExport: true,           // Export even in dev environment
    })

    bedrock.DefineCommonModels(bedrockPlugin, g)

    // Your flows and handlers here...
}
Google Cloud Telemetry Configuration
The GoogleCloudTelemetryOptions allows you to configure various aspects of the Google Cloud monitoring integration:
type GoogleCloudTelemetryOptions struct {
    // ProjectID is the Google Cloud project ID.
    // If empty, will be auto-detected from environment.
    ProjectID string

    // Credentials for authenticating with Google Cloud.
    // If nil, uses Application Default Credentials (ADC).
    // Primarily intended for use in environments outside of GCP.
    // On GCP, credentials will typically be inferred from the environment via ADC.
    Credentials *google.Credentials

    // Sampler controls trace sampling. If nil, uses AlwaysOnSampler.
    // Examples: AlwaysOnSampler, AlwaysOffSampler, TraceIdRatioBasedSampler
    Sampler sdktrace.Sampler

    // MetricExportIntervalMillis controls metrics export frequency.
    // Google Cloud requires minimum 5000ms. Defaults to 5000 (dev) or 300000 (prod).
    MetricExportIntervalMillis *int

    // MetricExportTimeoutMillis controls metrics export timeout.
    // Defaults to match MetricExportIntervalMillis.
    MetricExportTimeoutMillis *int

    // DisableMetrics disables metric export to Google Cloud.
    // Traces and logs may still be exported. Defaults to false.
    DisableMetrics bool

    // DisableTraces disables trace export to Google Cloud.
    // Metrics and logs may still be exported. Defaults to false.
    DisableTraces bool

    // DisableLoggingInputAndOutput disables input/output logging.
    // Defaults to false (input/output logging enabled).
    DisableLoggingInputAndOutput bool

    // ForceDevExport forces telemetry export even in development environment.
    // Defaults to false (only exports in production unless forced).
    ForceDevExport bool
}
The Google Cloud plugin uses specific Google Cloud exporters under the hood:
- Trace Exporter: Uses
github.com/GoogleCloudPlatform/opentelemetry-operations-go/exporter/traceto send traces to Google Cloud Trace with automatic PII filtering - Metrics Exporter: Uses
github.com/GoogleCloudPlatform/opentelemetry-operations-go/exporter/metricto send metrics to Google Cloud Monitoring - Logging Handler: Uses
cloud.google.com/go/loggingwith a custom slog handler to send structured logs to Google Cloud Logging
Required Google Cloud APIs
Before using Google Cloud monitoring, ensure these APIs are enabled in your Google Cloud Console:
- Cloud Logging API (
logging.googleapis.com): Enables centralized logging - Cloud Trace API (
cloudtrace.googleapis.com): Provides distributed tracing - Cloud Monitoring API (
monitoring.googleapis.com): Enables metrics and alerting
Google Cloud Monitoring Features
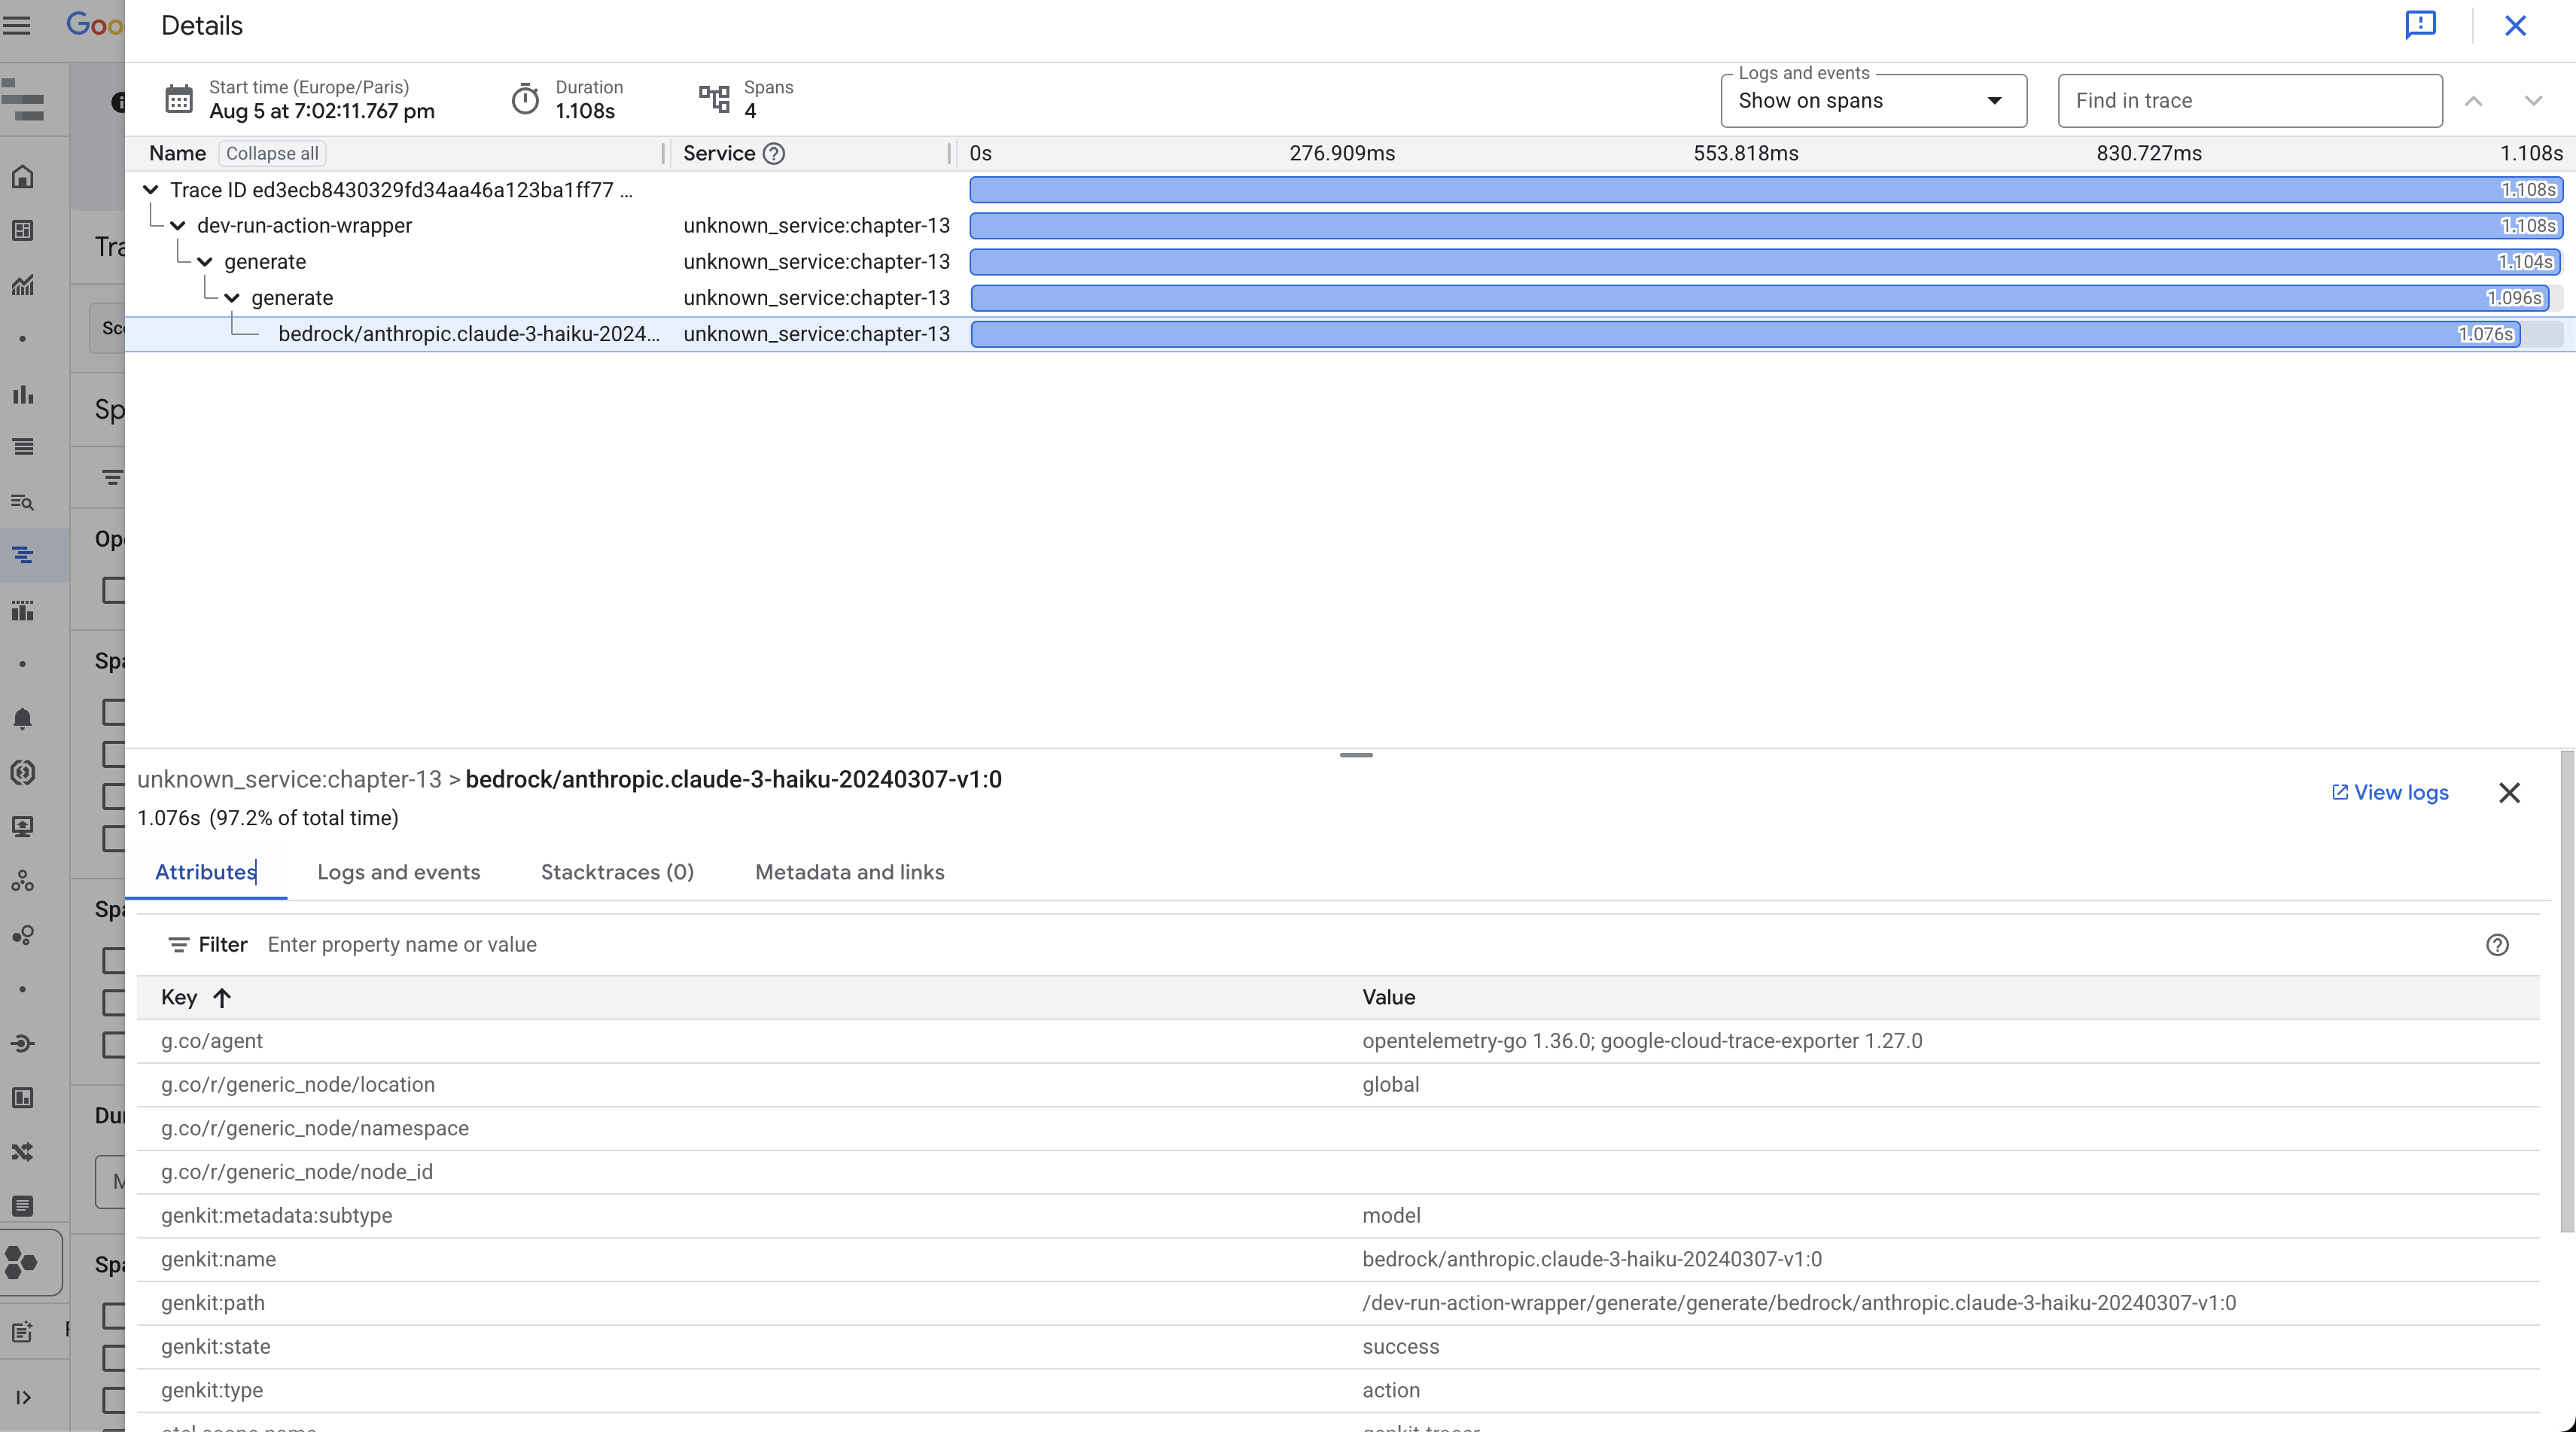
Cloud Trace: Distributed tracing for understanding request flows
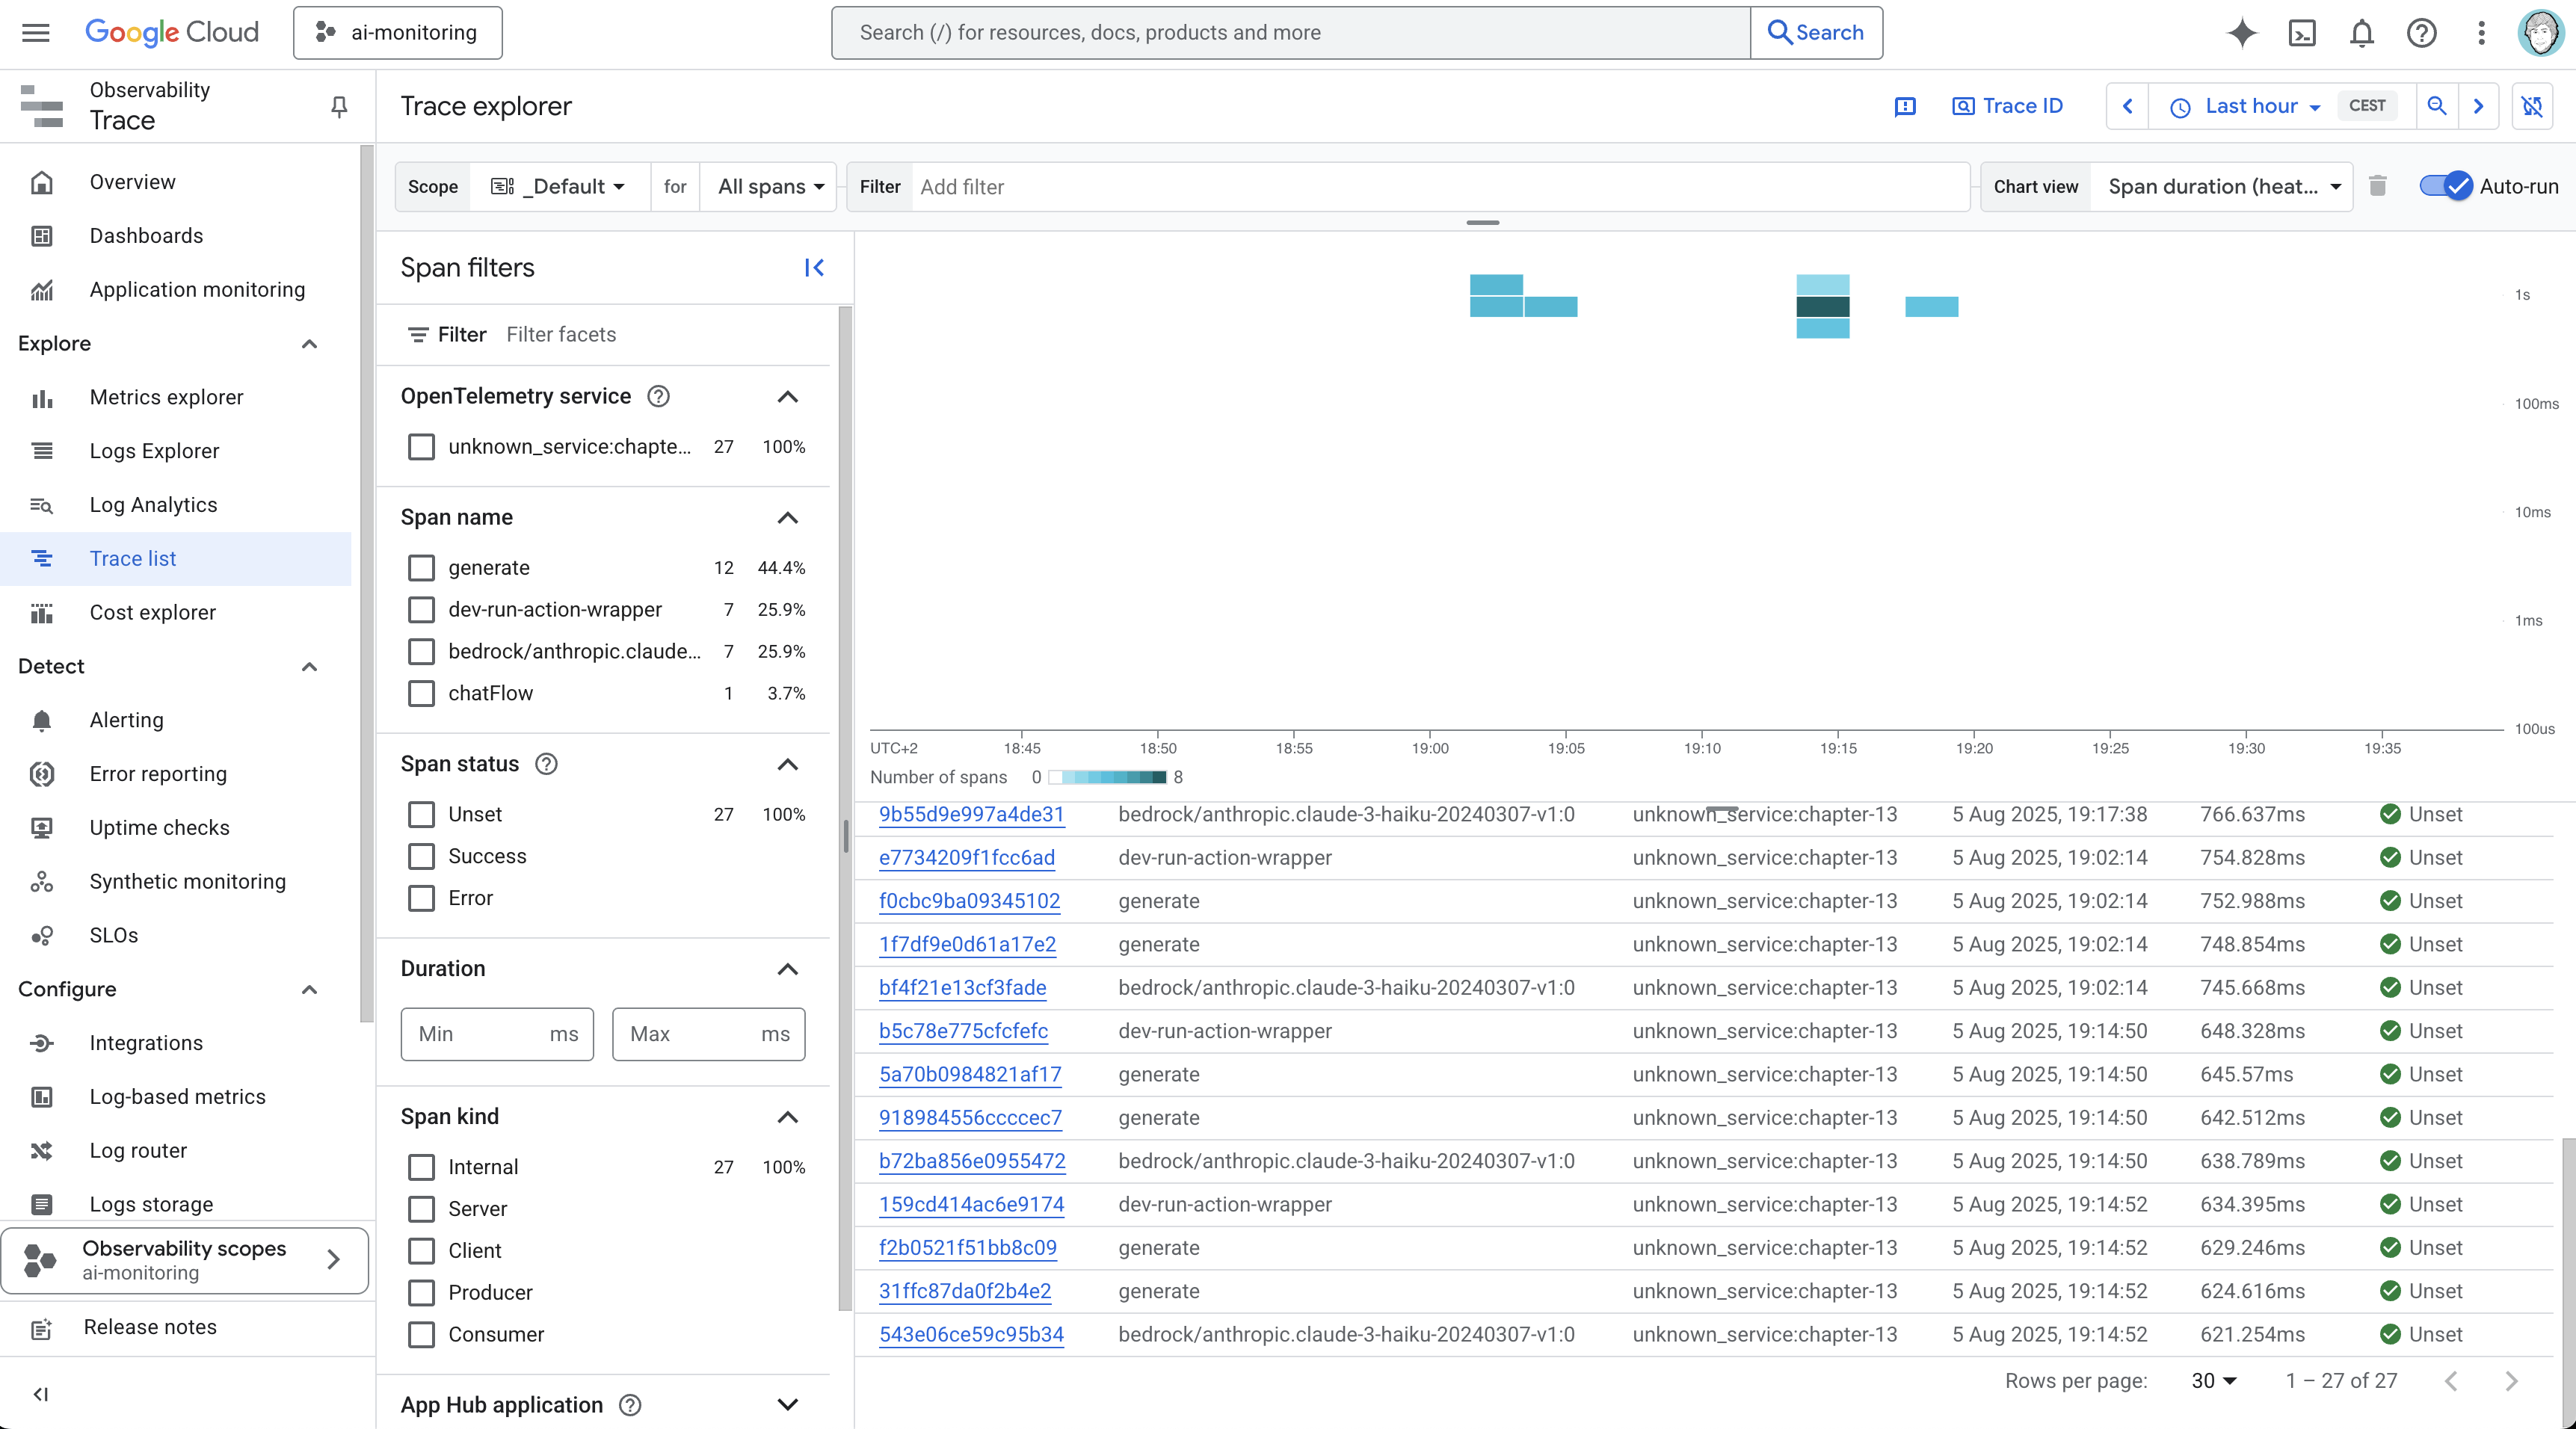
You can inspect each trace to see how requests propagate through your application, including model calls and tool executions:
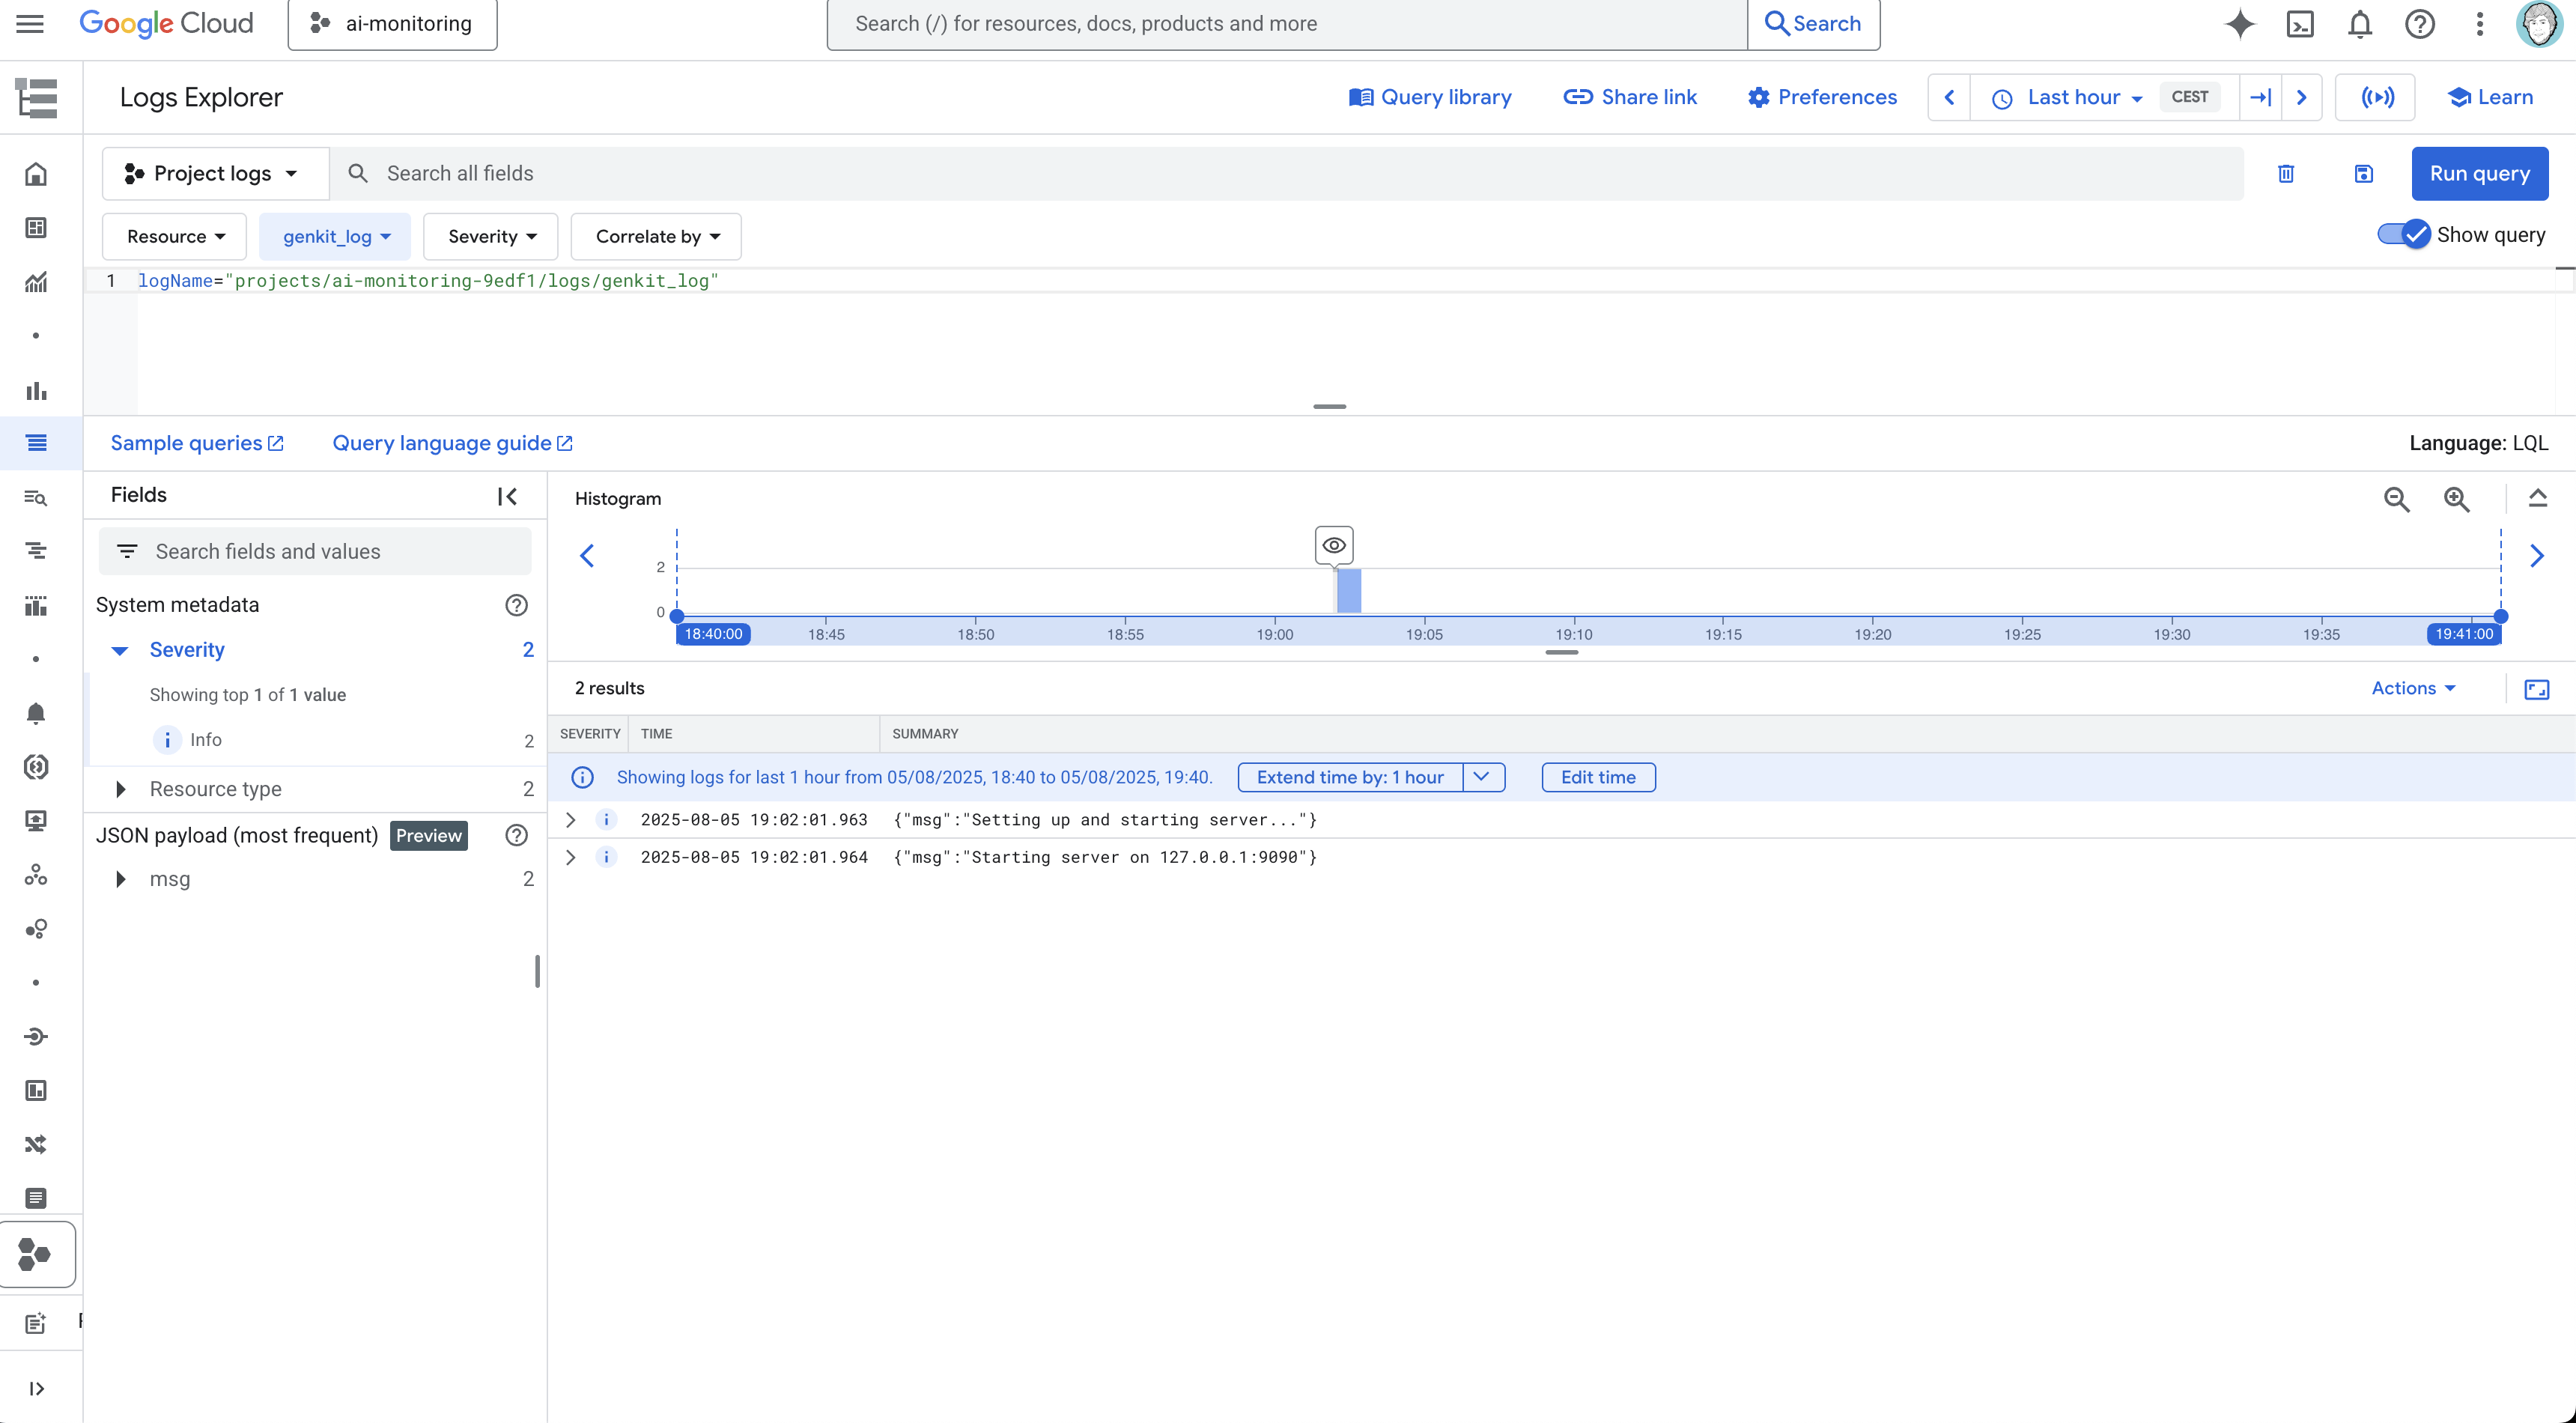
Cloud Logging: Centralized log management with powerful search and filtering
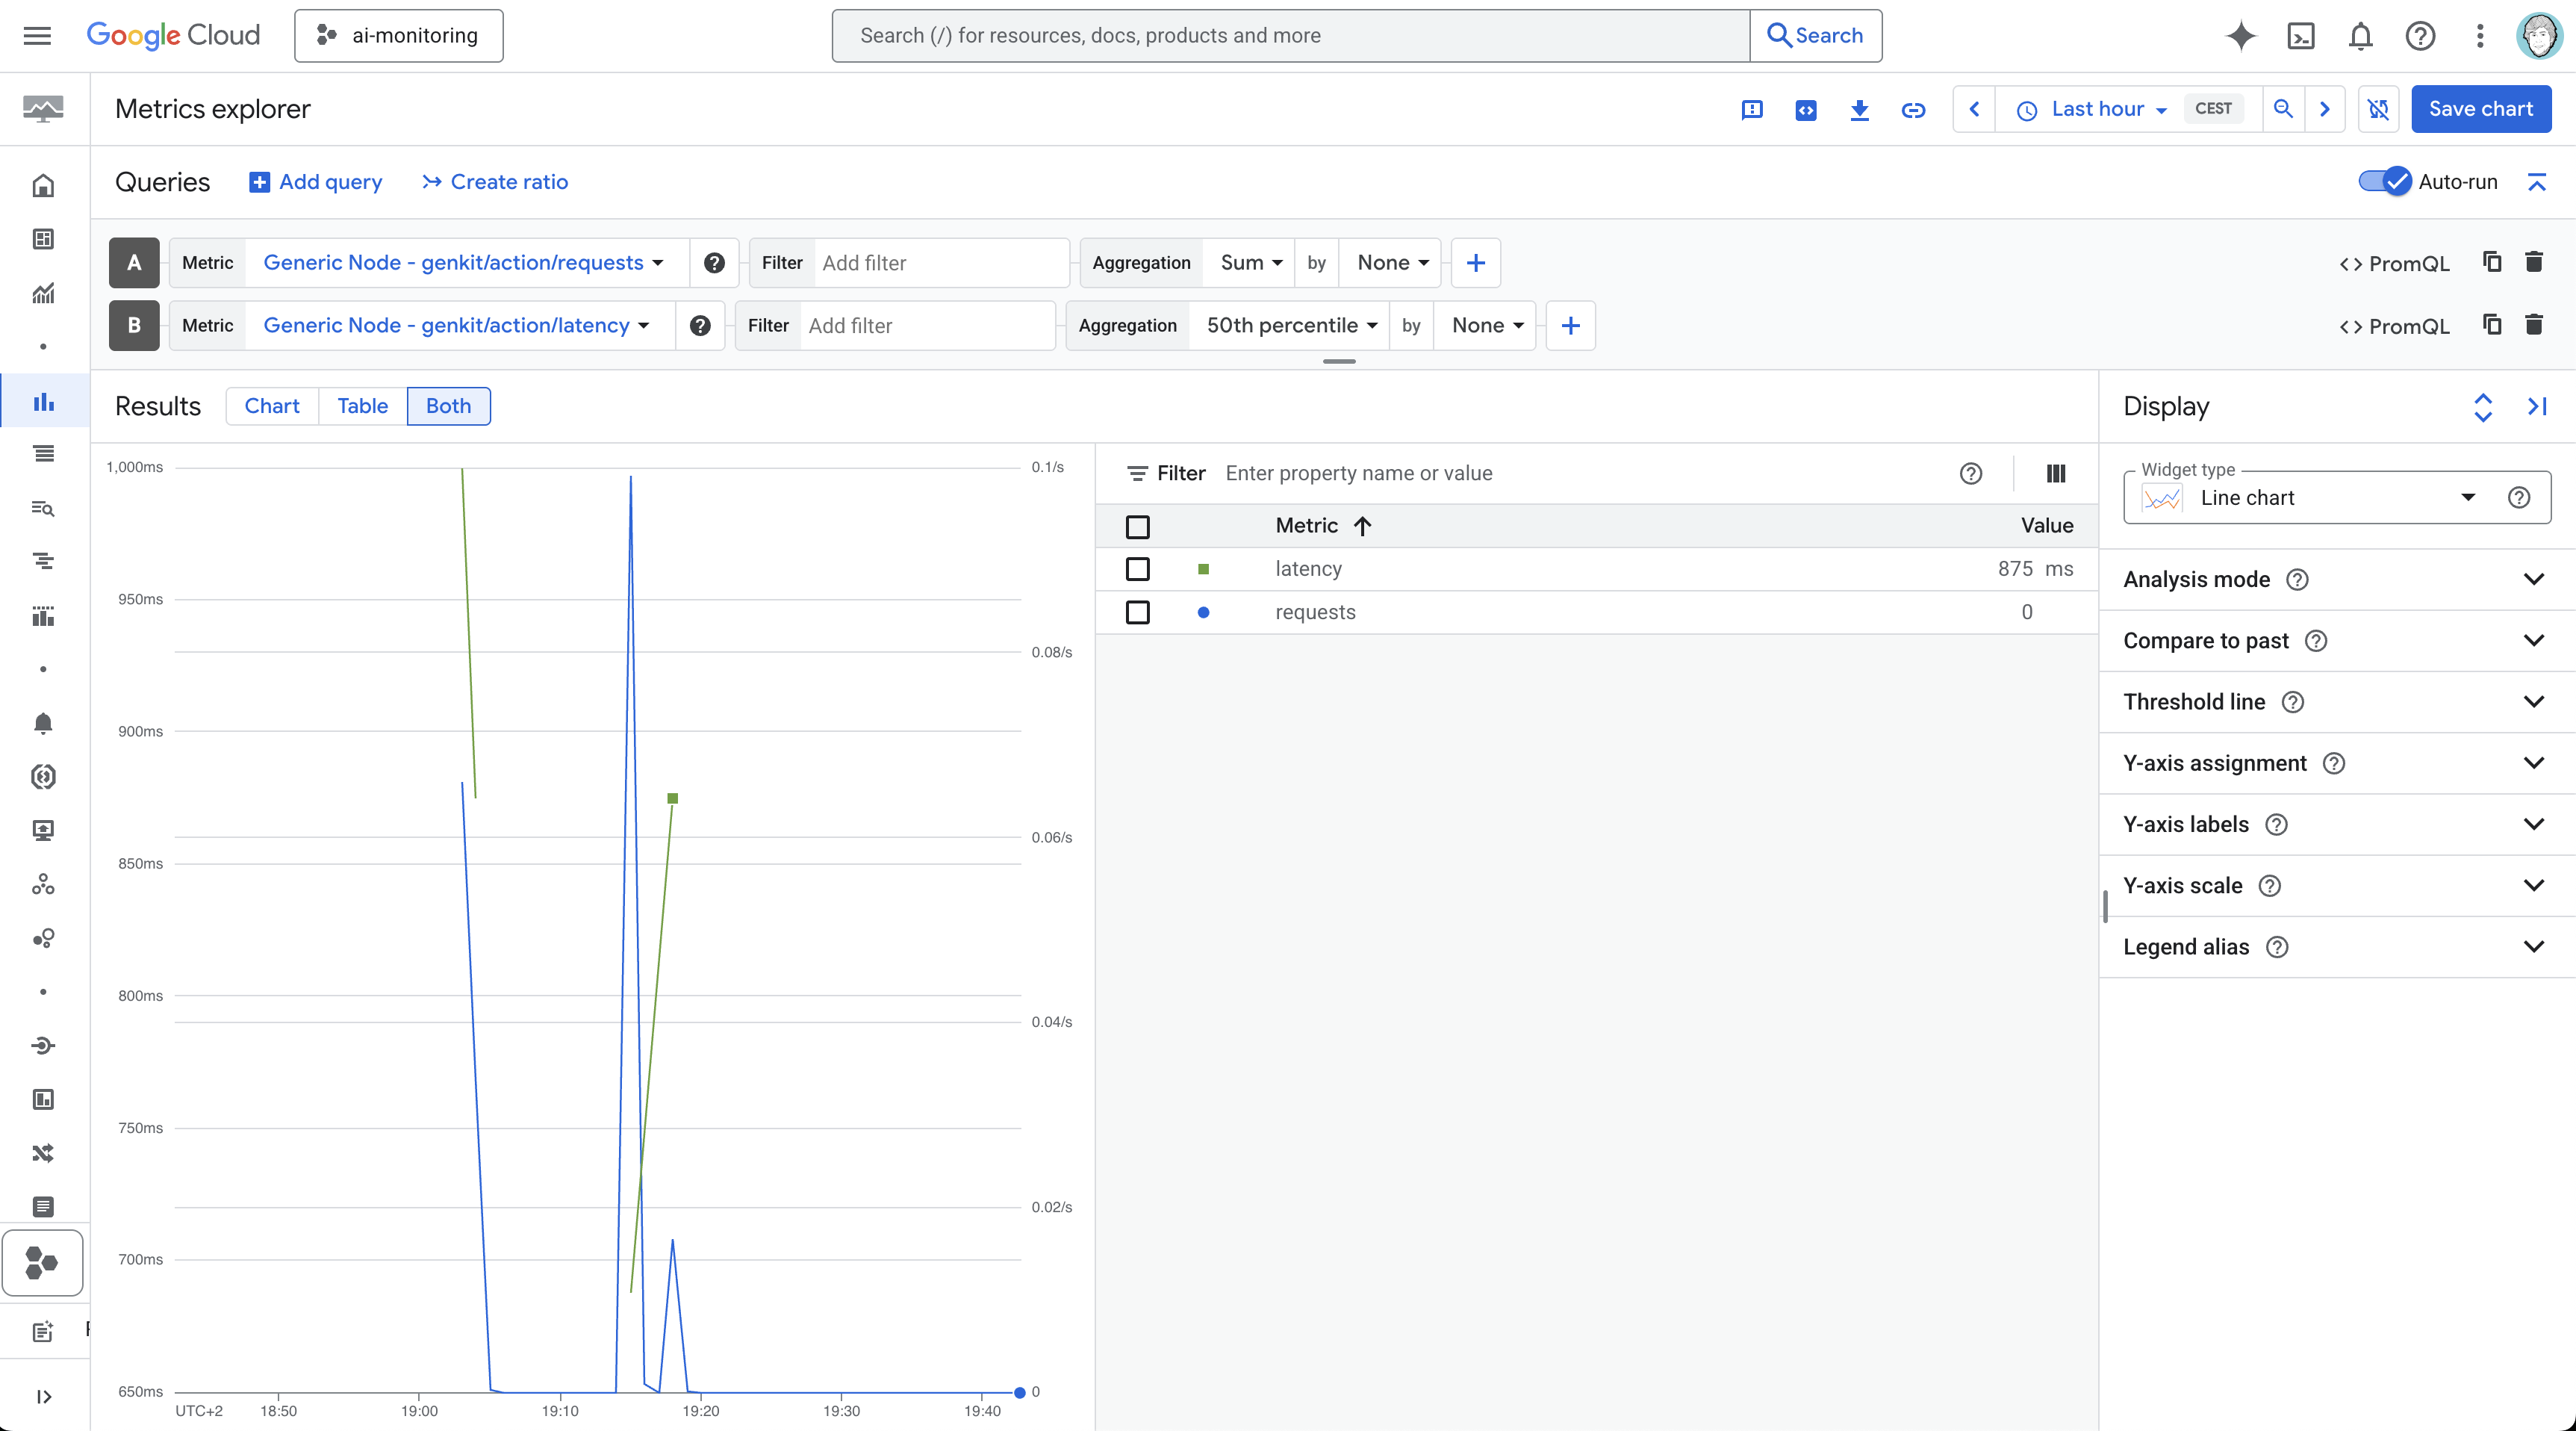
Cloud Monitoring: Custom metrics, dashboards, and alerting
OpenTelemetry: Open Source Monitoring
OpenTelemetry provides the most flexible monitoring solution, allowing you to use any compatible observability backend such as Prometheus, Jaeger, or commercial solutions.
Configuring OpenTelemetry
Genkit Go includes built-in OpenTelemetry support through the opentelemetry plugin:
import (
    opentelemetry "github.com/xavidop/genkit-opentelemetry-go"
)

func main() {
    ctx := context.Background()

    g := genkit.Init(ctx,
        genkit.WithPlugins(
            opentelemetry.NewWithPreset(opentelemetry.PresetOTLP, opentelemetry.Config{
                ServiceName:    "my-genkit-app",
                ForceExport:    true,
                MetricInterval: 15 * time.Second,
            }),
        ),
    )
}
The plugin is quite configurable, allowing you to set the service name, export intervals, and more:
type Config struct {
    // Export even in the dev environment
    ForceExport bool

    // The interval for exporting metric data (default: 60s)
    MetricInterval time.Duration

    // The minimum level at which logs will be written (default: Info)
    LogLevel slog.Leveler

    // Custom trace span exporter (optional)
    TraceExporter trace.SpanExporter

    // Custom metric exporter (optional)
    MetricExporter metric.Exporter

    // Custom log handler (optional)
    LogHandler slog.Handler

    // OTLP endpoint (default: "localhost:4317")
    OTLPEndpoint string

    // Whether to use HTTP instead of gRPC for OTLP (default: false)
    OTLPUseHTTP bool

    // Headers to include in OTLP requests
    OTLPHeaders map[string]string

    // Service name for telemetry data (default: "genkit-service")
    ServiceName string

    // Service version for telemetry data
    ServiceVersion string

    // Additional resource attributes
    ResourceAttributes map[string]string
}
Thanks to this plugnin you can monitor your Genkit Go applications using open-source tools like Prometheus, Jaeger, and Grafana:
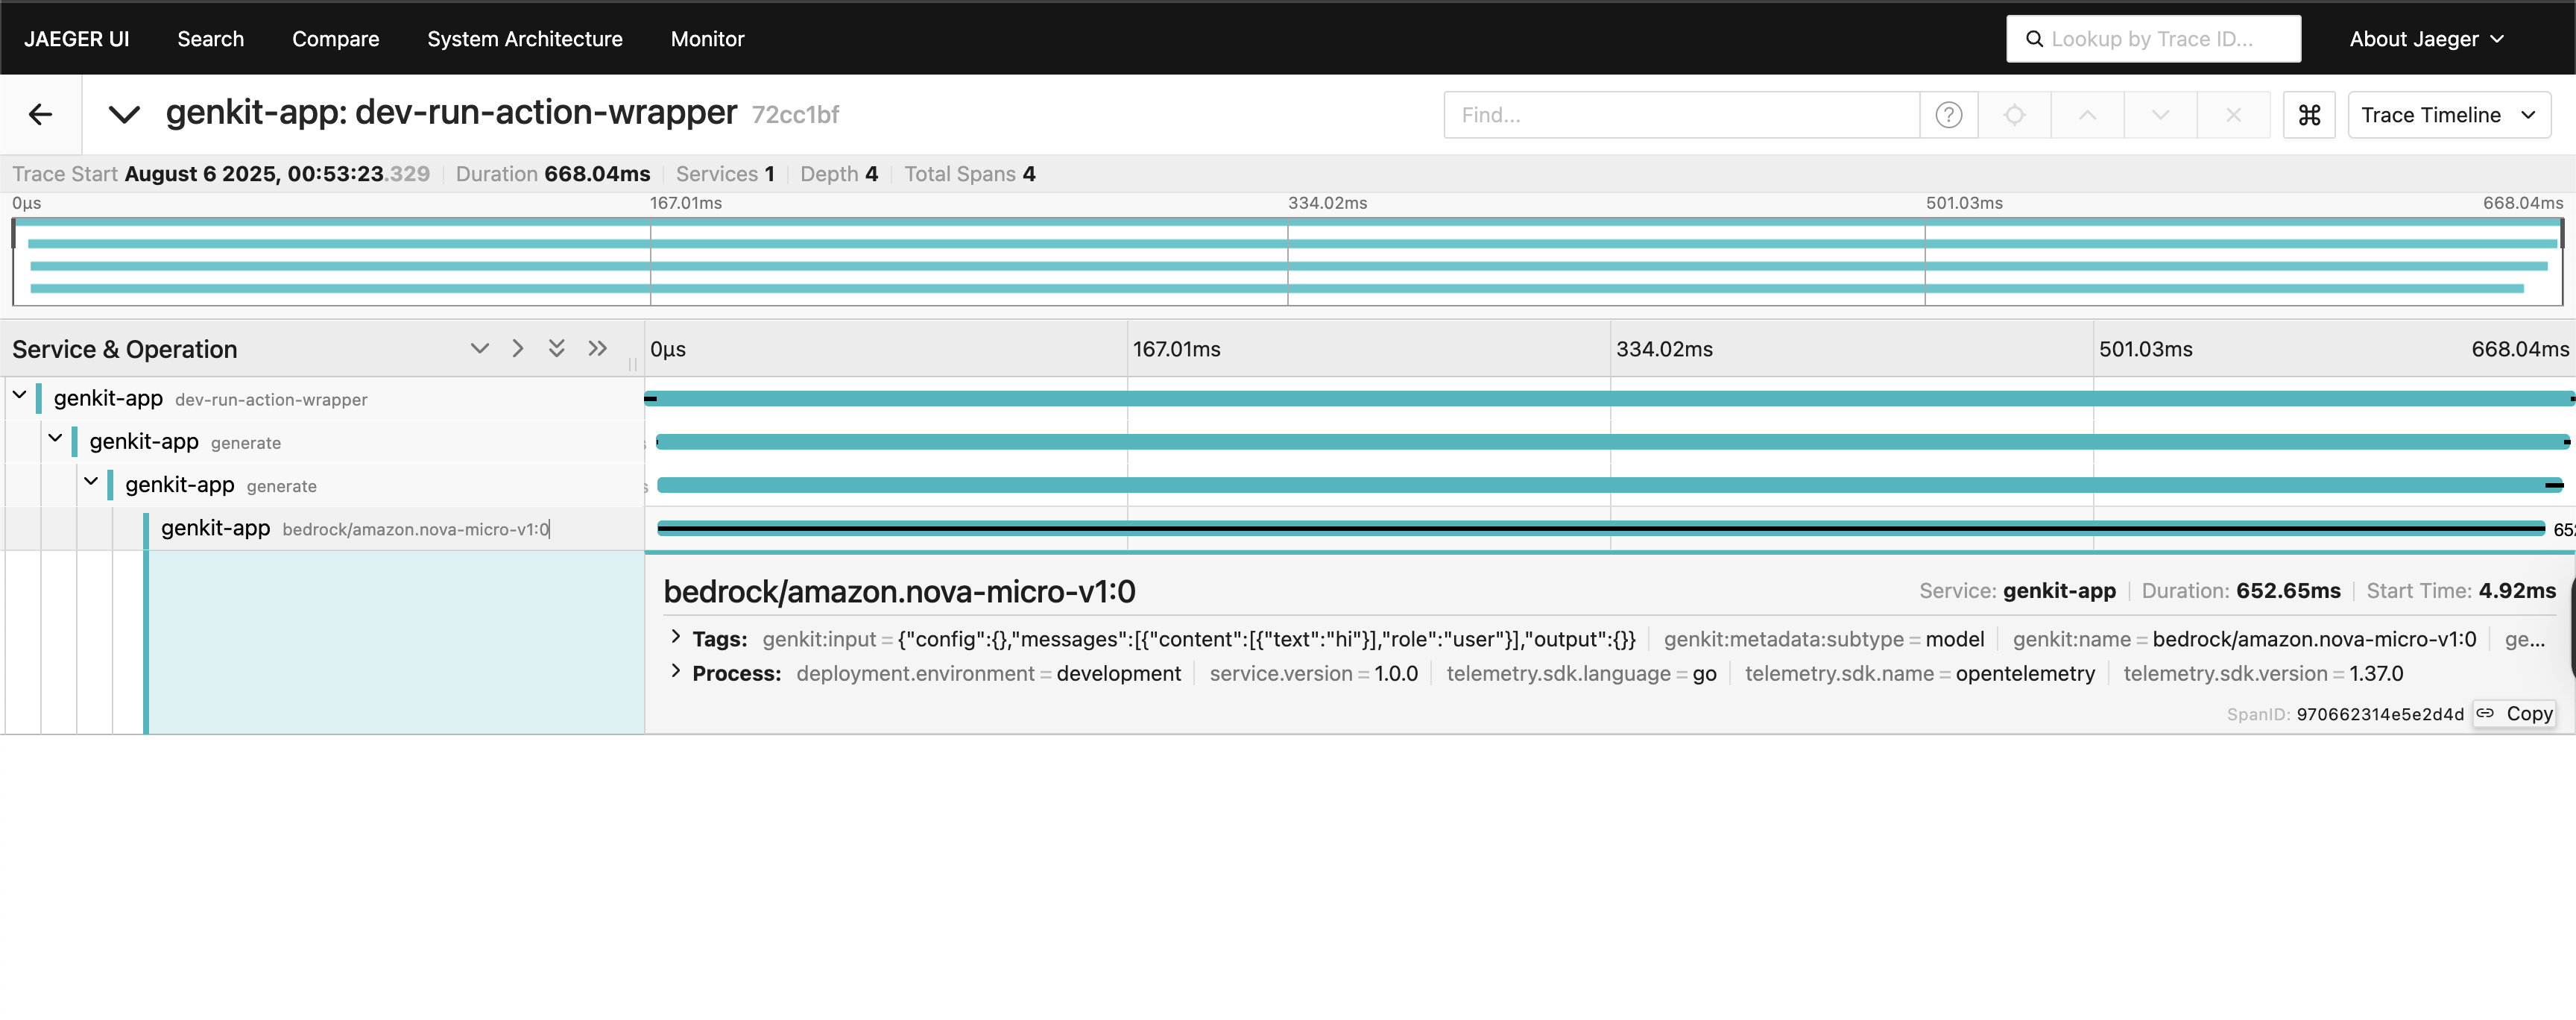
Traces in Jaeger:
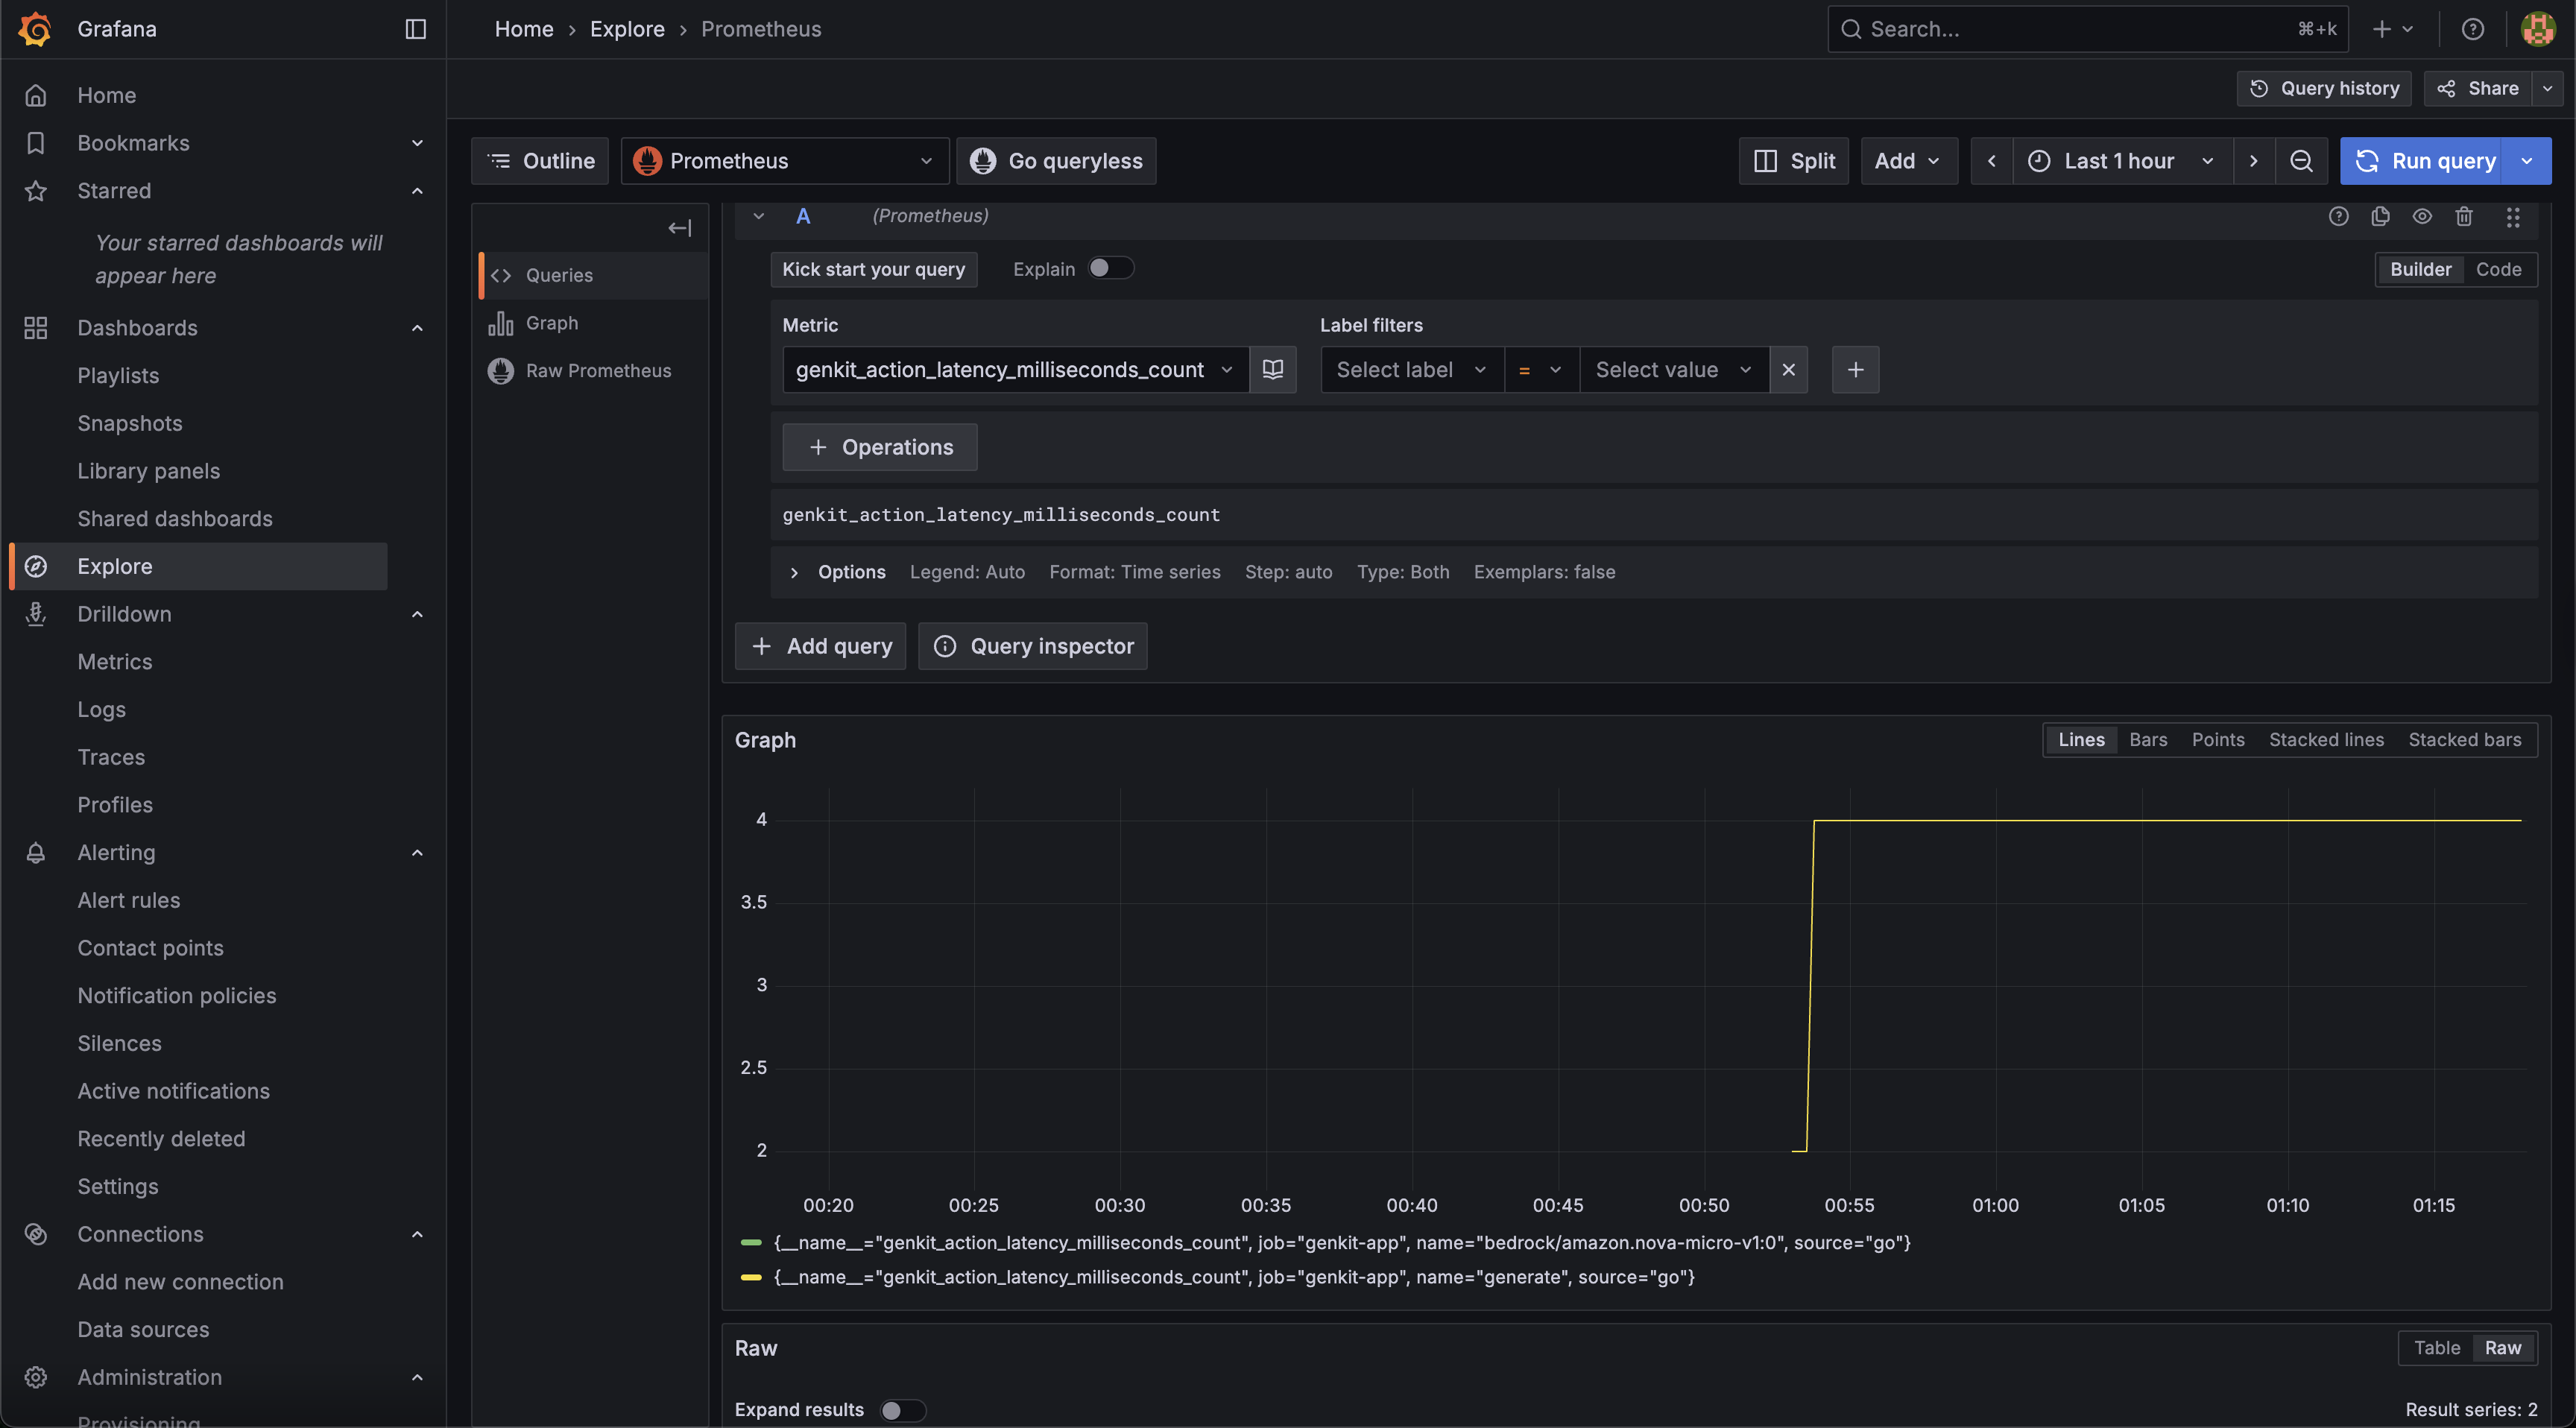
Metrics in Grafana from Prometheus:
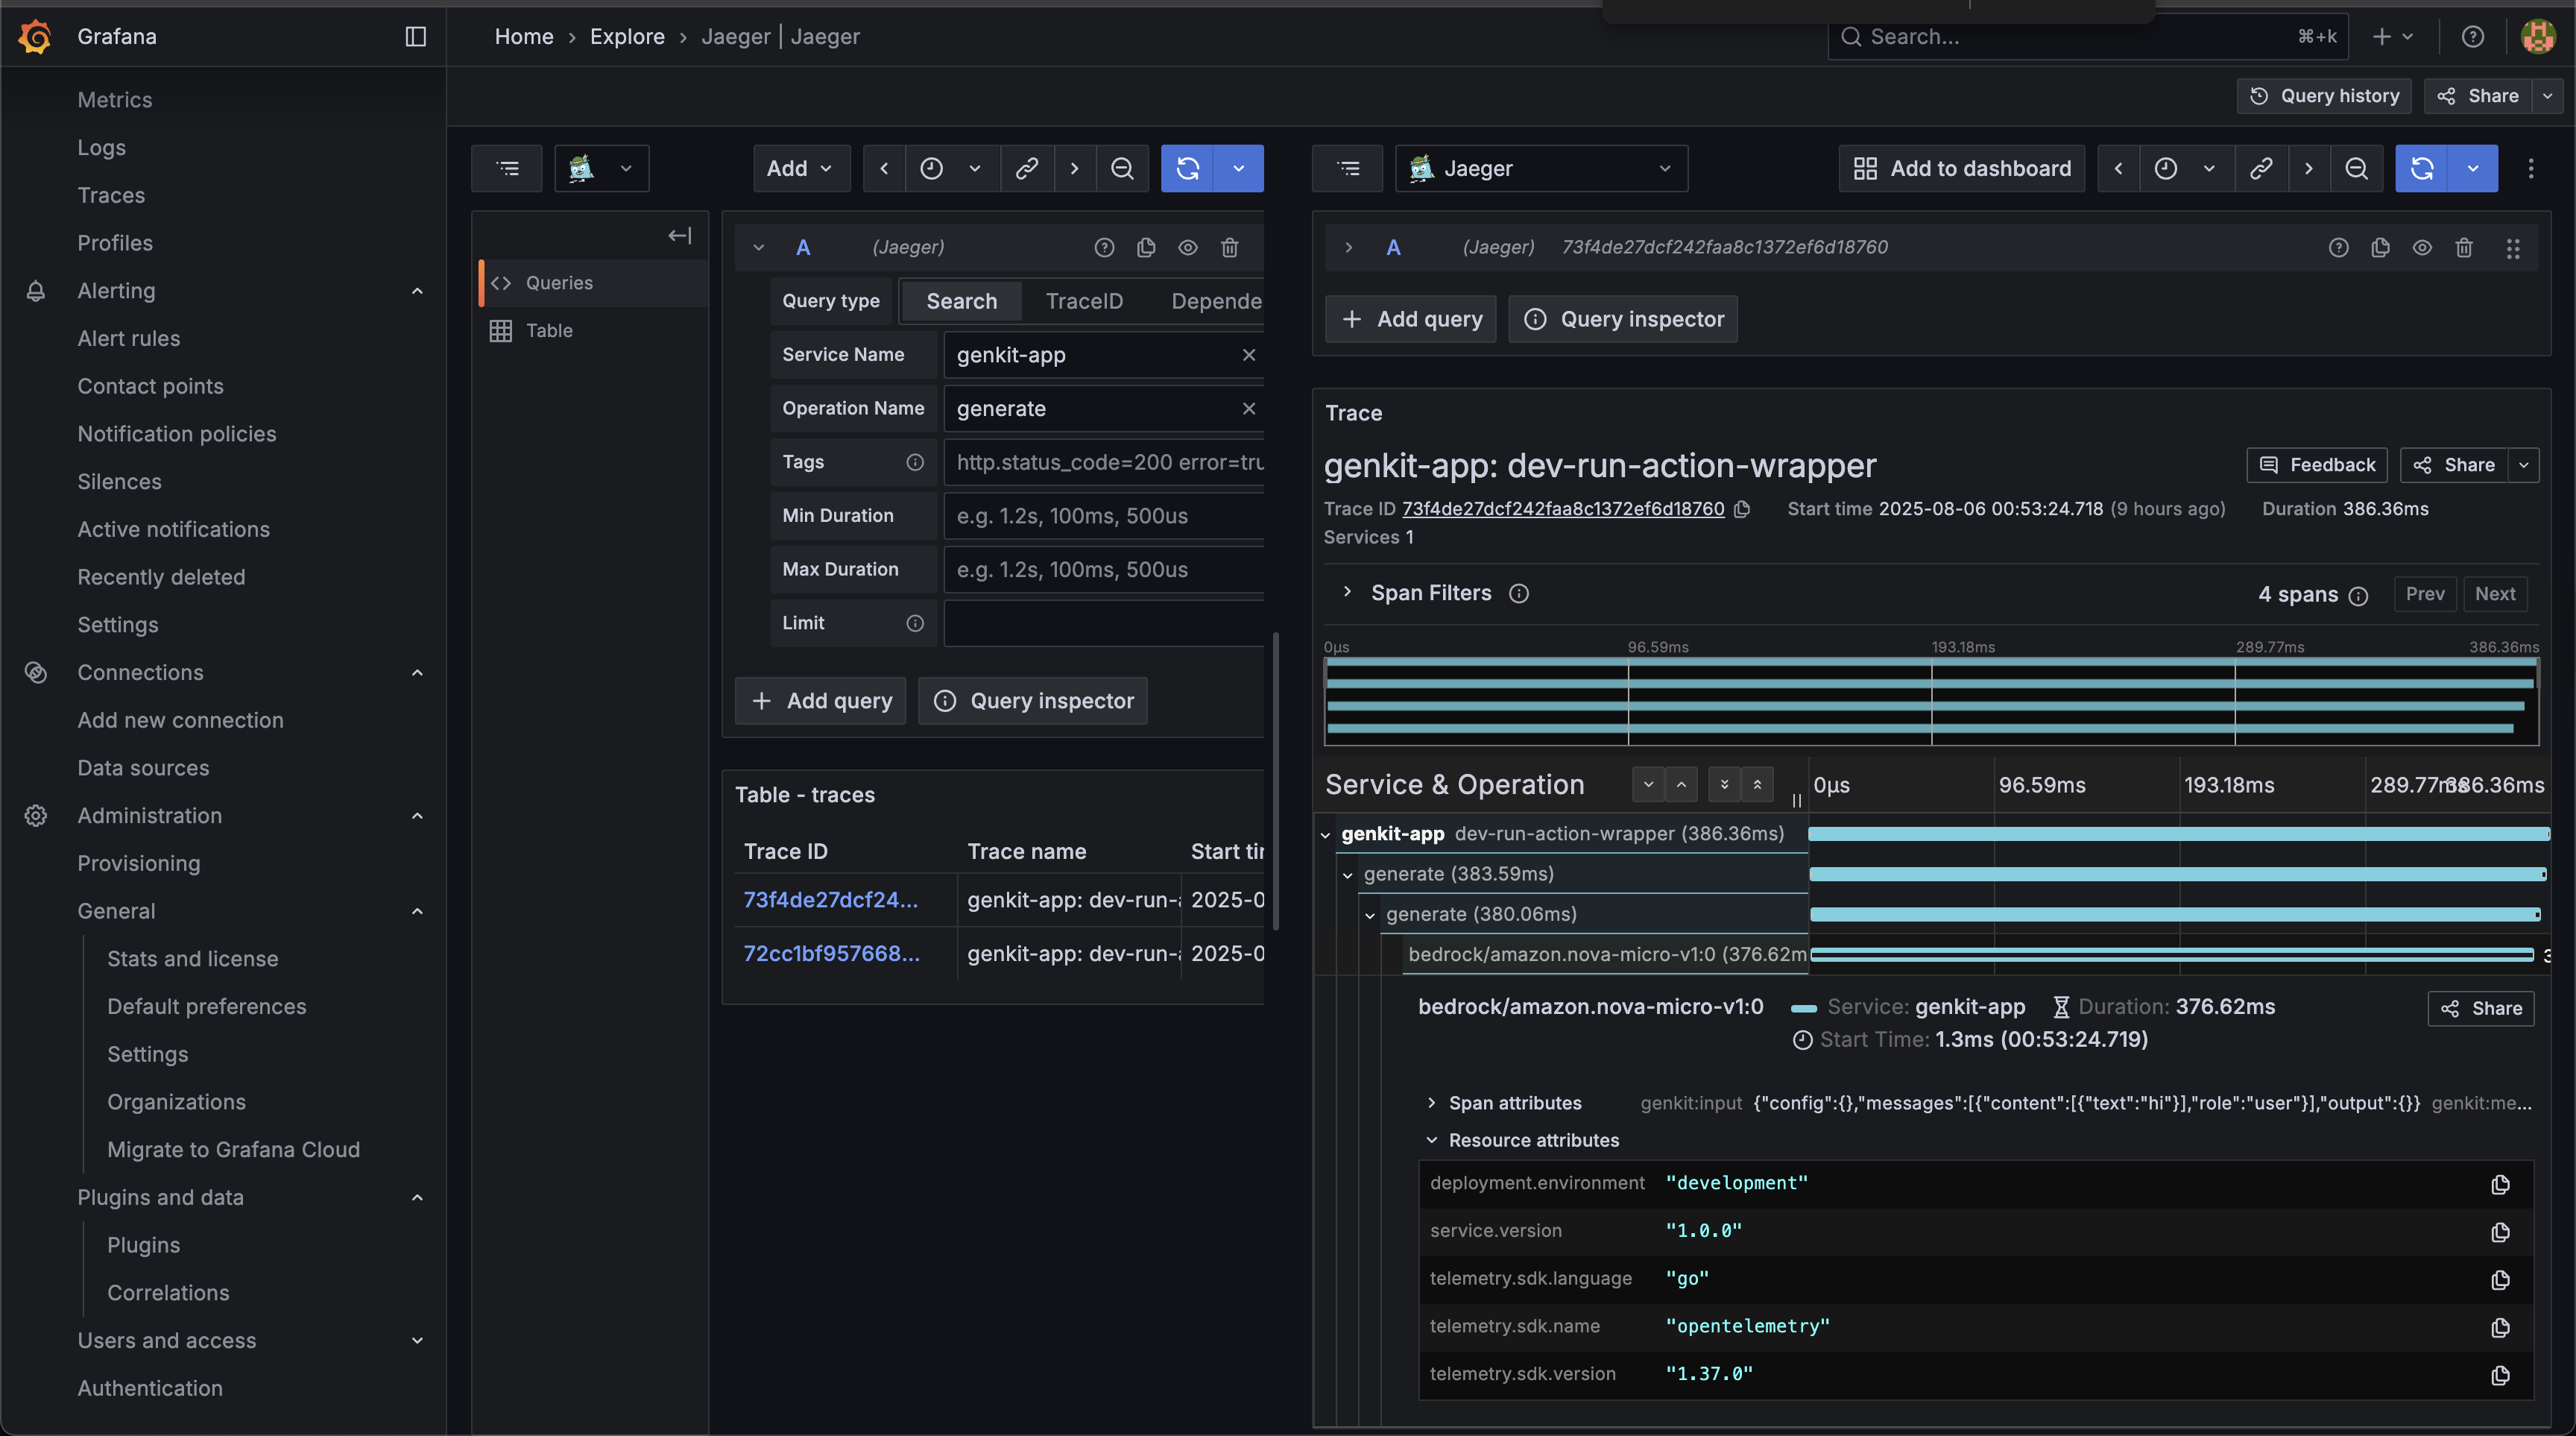
Traces in Grafana from Jaeger:
OpenTelemetry Presets
The OpenTelemetry plugin supports several presets for common monitoring setups:
- PresetOTLP: For OpenTelemetry Collector (OTLP) exporters
- PresetJaeger: For Jaeger tracing backend
- PresetPrometheus: For Prometheus metrics collection
- PresetConsole: For console output (debugging)
Custom OpenTelemetry Configuration
For advanced use cases, you can provide custom configuration:
opentelemetry.New(opentelemetry.Config{
    ServiceName:    "my-service",
    ServiceVersion: "1.0.0",
    ForceExport:    true,
    MetricInterval: 30 * time.Second,
    TraceExporter:  customTraceExporter,
    MetricExporter: customMetricExporter,
})
Other Vendors: Using OpenTelemetry Integration
Thanks to OpenTelemetry’s vendor-neutral approach, you can integrate Genkit Go with any observability platform. Popular options include Datadog, New Relic, Grafana, and many others.
The genkit-opentelemetry-go repository provides examples for various vendor integrations:
- Datadog: Direct integration with Datadog APM
- New Relic: Sending traces and metrics to New Relic
- Grafana Stack: Using Grafana, Prometheus, and Jaeger
- Elastic Stack: Integration with Elasticsearch and Kibana
Datadog
import (
    "go.opentelemetry.io/otel/exporters/otlp/otlptrace/otlptracehttp"
)

func setupDatadog() {
    exporter, err := otlptracehttp.New(
        context.Background(),
        otlptracehttp.WithEndpoint("https://trace-intake.datadoghq.com"),
        otlptracehttp.WithHeaders(map[string]string{
            "DD-API-KEY": os.Getenv("DD_API_KEY"),
        }),
    )

    // Use with Genkit OpenTelemetry plugin
    opentelemetry.New(opentelemetry.Config{
        ServiceName:   "my-genkit-app",
        TraceExporter: exporter,
    })
}
Honeycomb
otelPlugin := opentelemetry.New(opentelemetry.Config{
    ServiceName:  "my-app",
    OTLPEndpoint: "https://api.honeycomb.io",
    OTLPUseHTTP:  true,
    OTLPHeaders: map[string]string{
        "x-honeycomb-team": os.Getenv("HONEYCOMB_API_KEY"),
    },
})
New Relic
otelPlugin := opentelemetry.New(opentelemetry.Config{
    ServiceName:  "my-app",
    OTLPEndpoint: "https://otlp.nr-data.net",
    OTLPUseHTTP:  true,
    OTLPHeaders: map[string]string{
        "api-key": os.Getenv("NEW_RELIC_LICENSE_KEY"),
    },
})
Available Metrics and Traces
Genkit Go provides instrumentation covering all aspects of your AI application. For a complete list of available metrics and traces, refer to the official documentation.
Best Practices for Monitoring Genkit Go Applications
- Start with Development UI: Use the built-in Genkit UI during development for immediate feedback
- Choose the Right Backend: Select a monitoring solution that fits your deployment environment and requirements
- Set Up Alerting: Configure alerts for critical metrics like error rates and latency
- Monitor Token Usage: Track model token consumption for cost optimization
- Use Custom Metrics: Add business-specific metrics to understand application behavior
- Implement Proper Logging: Use structured logging with appropriate levels
- Regular Review: Regularly review dashboards and metrics to identify optimization opportunities
Conclusion
Genkit Go’s observability features ensure you have full visibility into your AI applications, whether you’re developing locally or running in production. The choice between Google Cloud monitoring, OpenTelemetry integration, or other vendor solutions depends on your specific requirements, deployment environment, and existing infrastructure.
The built-in instrumentation means you get immediate value without additional configuration, while the OpenTelemetry foundation provides flexibility to adapt to any monitoring strategy as your application grows and evolves.